Environmental Science 12th Edition by William Cunningham,Mary Ann Cunningham
Edition 12ISBN: 978-0077431204Environmental Science 12th Edition by William Cunningham,Mary Ann Cunningham
Edition 12ISBN: 978-0077431204 Exercise 7
The previous data analysis lets you work through an example of population growth by hand, which is an important strategy for understanding the equations you've seen in this chapter.
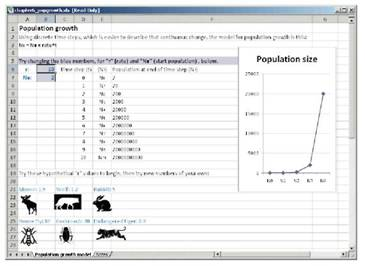
Now try experimenting with more growth rates in an Excel "model." What value of r makes the graph extremely steep What value makes it flat Can you model a declining population
Go to www.mhhe.com \cunningham12e , and find the Data Analysis option for this chapter. There you can download an Excel workbook and experiment with different growth rates.
Explanation Verified
Numbers 1 (e.g., 3 o...
Environmental Science 12th Edition by William Cunningham,Mary Ann Cunningham
Why don’t you like this exercise?
Other Minimum 8 character and maximum 255 character
Character 255


