Environmental Science 12th Edition by William Cunningham,Mary Ann Cunningham
Edition 12ISBN: 978-0077431204Environmental Science 12th Edition by William Cunningham,Mary Ann Cunningham
Edition 12ISBN: 978-0077431204 Exercise 12
Figure 13.32 on p. 291 is a form of graphic representation we haven t used very often in this book. It's a concept map, or a twodimensional representation of the relationship between key ideas. It could also be considered a decision flowchart because it's an organized presentation of different policy options. This kind of chart shows how we might think about a situation, and suggests affinities and associations that might not otherwise be obvious. You might like to look at the introductory chapter of this book for more information about concept maps.
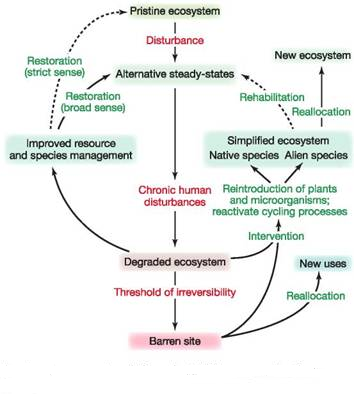
A model of ecosystem degradation and potential management options.
Source: Data from Walker and Moral, 2003.
What do you suppose the authors meant by a "threshold of irreversibility" If the system is irreversible, why are there arrows for reallocation or intervention
A model of ecosystem degradation and potential management options.
Source: Data from Walker and Moral, 2003.
What do you suppose the authors meant by a "threshold of irreversibility" If the system is irreversible, why are there arrows for reallocation or intervention
Explanation Verified
Restoration is one of the methods to rev...
Environmental Science 12th Edition by William Cunningham,Mary Ann Cunningham
Why don’t you like this exercise?
Other Minimum 8 character and maximum 255 character
Character 255


