Environmental Science 12th Edition by William Cunningham,Mary Ann Cunningham
Edition 12ISBN: 978-0077431204Environmental Science 12th Edition by William Cunningham,Mary Ann Cunningham
Edition 12ISBN: 978-0077431204 Exercise 9
The Intergovernmental Panel on Climate Change (IPCC) has a rich repository of figures and data, and because these data are likely to influence some policy actions in your future, it s worthwhile taking a few minutes to look at the IPCC reports.
The most brief and to the point is the Summary for Policy Makers (SPM) that accompanies the fourth Assessment Report. You can find the summary at www.ipcc.ch \ipccreports \ar4-syr.htm. If you have time, the full report is also available at this site.
Open the SPM and look at the first page of text, then look at the first figure, SPM1 (reproduced here). Look at this figure carefully and answer the following questions:
The left axis for all three graphs shows the difference between each year's observations and an average value. What values are averaged
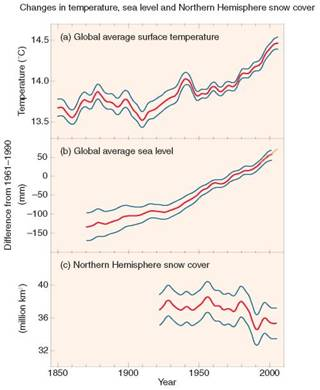
Explanation Verified
The vertical axis shows differ...
Environmental Science 12th Edition by William Cunningham,Mary Ann Cunningham
Why don’t you like this exercise?
Other Minimum 8 character and maximum 255 character
Character 255


