Environmental Science 12th Edition by William Cunningham,Mary Ann Cunningham
Edition 12ISBN: 978-0077431204Environmental Science 12th Edition by William Cunningham,Mary Ann Cunningham
Edition 12ISBN: 978-0077431204 Exercise 22
The Intergovernmental Panel on Climate Change (IPCC) has a rich repository of figures and data, and because these data are likely to influence some policy actions in your future, it s worthwhile taking a few minutes to look at the IPCC reports.
The most brief and to the point is the Summary for Policy Makers (SPM) that accompanies the fourth Assessment Report. You can find the summary at www.ipcc.ch \ipccreports \ar4-syr.htm. If you have time, the full report is also available at this site.
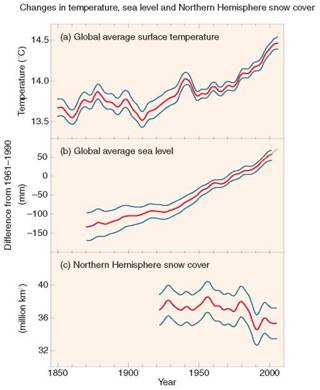
Open the SPM and look at the first page of text, then look at the first figure, SPM1 (reproduced here). Look at this figure carefully and answer the following questions:
Nearly every page of the IPCC report has graphs that show quite interesting details when you take the time to look at them. Choose two other graphs in the SPM document and explain the main messages they give. See if you can explain them clearly enough to communicate the main idea to a friend or family member. Have different students select different graphs and explain them to the class.
The most brief and to the point is the Summary for Policy Makers (SPM) that accompanies the fourth Assessment Report. You can find the summary at www.ipcc.ch \ipccreports \ar4-syr.htm. If you have time, the full report is also available at this site.
Open the SPM and look at the first page of text, then look at the first figure, SPM1 (reproduced here). Look at this figure carefully and answer the following questions:
Nearly every page of the IPCC report has graphs that show quite interesting details when you take the time to look at them. Choose two other graphs in the SPM document and explain the main messages they give. See if you can explain them clearly enough to communicate the main idea to a friend or family member. Have different students select different graphs and explain them to the class.
Explanation Verified
Answers will depend on the gra...
Environmental Science 12th Edition by William Cunningham,Mary Ann Cunningham
Why don’t you like this exercise?
Other Minimum 8 character and maximum 255 character
Character 255


