Macroeconomics 5th Edition by Olivier Blanchard
Edition 5ISBN: 978-0132159869Macroeconomics 5th Edition by Olivier Blanchard
Edition 5ISBN: 978-0132159869 Exercise 4
Inflation targeting and the Taylor rule in the IS-LM model
Consider a closed economy in which the central bank follows an interest rate rule. The IS relation is given by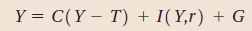
Where r is the real interest rate.
The central bank sets the nominal interest rate according to the rule
Where
is expected inflation,
is the target rate of inflation, and Y n is the natural level of output. Assume that a 1 and b 0. The symbol i* is the target interest rate the central bank chooses when expected inflation equals the target rate and output equals the natural level. The central bank will increase the nominal interest rate when expected inflation rises above the target, or when output rises above the natural level.
(Note that the Taylor rule described in this chapter uses actual inflation instead of expected inflation, and it uses unemployment instead of output. The interest rate rule we use in this problem simplifies the analysis and does not change the basic results.)
Real and nominal interest rates are related by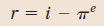
a. Define the variable
Use the definition of the real interest rate to express the interest rate rule as
(Hint: Subtract
from each side of the nominal interest rate rule and rearrange the right-hand side of the equation.)
b. Graph the IS relation in a diagram, with r on the vertical axis and Y on the horizontal axis. In the same diagram, graph the interest rate rule (in terms of the real interest rate) you derived in part (a) for given values of
and Y n. Call the interest rate rule the monetary policy (MP) relation.
c. Using the diagram you drew in part (b), show that an increase in government spending leads to an increase in output and the real interest rate in the short run.
d. Now consider a change in the monetary policy rule. Suppose the central bank reduces its target inflation rate,
. How does the fall in
affect the MP relation (Remember that a 1.) What happens to output and the real interest rate in the short run
Explanation

This question doesn’t have an expert verified answer yet, let Examlex AI Copilot help.
Macroeconomics 5th Edition by Olivier Blanchard
Why don’t you like this exercise?
Other Minimum 8 character and maximum 255 character
Character 255


