Environmental Science 15th Edition by Scott Spoolman,Tyler Miller
Edition 15ISBN: 978-1305090446Environmental Science 15th Edition by Scott Spoolman,Tyler Miller
Edition 15ISBN: 978-1305090446 Exercise 8
Consider the graph to the right that compares the losses of calcium from the experimental and control sites in the Hubbard Brook Experimental Forest ( Core Case Study ). Note that this figure is very similar to Figure 2.5, which compares loss of nitrates from the two sites. After studying this graph, answer these questions.
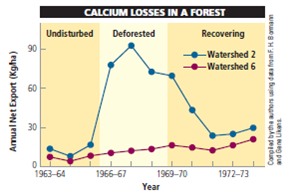
In what year did the calcium loss from the experimental site begin a sharp increase? In what year did it peak? In what year did it again level off?
In what year did the calcium loss from the experimental site begin a sharp increase? In what year did it peak? In what year did it again level off?
Explanation Verified
The change in calcium concentration for ...
Environmental Science 15th Edition by Scott Spoolman,Tyler Miller
Why don’t you like this exercise?
Other Minimum 8 character and maximum 255 character
Character 255


