
Environmental Science 15th Edition by Scott Spoolman,Tyler Miller
Edition 15ISBN: 978-1305090446Environmental Science 15th Edition by Scott Spoolman,Tyler Miller
Edition 15ISBN: 978-1305090446 Exercise 20
A fishprint provides a measure of a country's fish harvest in terms of area. The unit of area used in fishprint analysis is the global hectare (gha), a unit weighted to reflect the relative ecological productivity of the area fished. When compared with the fishing area's sustainable biocapacity (its ability to provide a stable supply of fish year after year, expressed in terms of yield per area), its fishprint indicates whether the country's annual fishing harvest is sustainable. The fishprint and biocapacity are calculated using the following formulas:
Fishprint in (gha) = metric tons of fish harvested per year/productivity in metric tons per hectare × weighting factor
Biocapacity in (gha) = sustained yield of fish in metric tons per year/productivity in metric tons per hectare × weighting factor
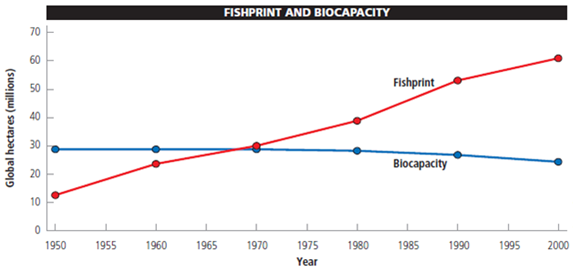
The following graph shows the earth's total fishprint and biocapacity between 1950 and 2000. Study it and answer the following questions.
Assume a country harvests 18 million metric tons of fish annually from an ocean area with an average productivity of 1.3 metric tons per hectare and a weighting factor of 2.68. What is the annual fishprint of that country?
Fishprint in (gha) = metric tons of fish harvested per year/productivity in metric tons per hectare × weighting factor
Biocapacity in (gha) = sustained yield of fish in metric tons per year/productivity in metric tons per hectare × weighting factor
The following graph shows the earth's total fishprint and biocapacity between 1950 and 2000. Study it and answer the following questions.
Assume a country harvests 18 million metric tons of fish annually from an ocean area with an average productivity of 1.3 metric tons per hectare and a weighting factor of 2.68. What is the annual fishprint of that country?
Explanation Verified
The fishprint and biocapacity was compar...
Environmental Science 15th Edition by Scott Spoolman,Tyler Miller
Why don’t you like this exercise?
Other Minimum 8 character and maximum 255 character
Character 255


