
Environmental Science 15th Edition by Scott Spoolman,Tyler Miller
Edition 15ISBN: 978-1305090446Environmental Science 15th Edition by Scott Spoolman,Tyler Miller
Edition 15ISBN: 978-1305090446 Exercise 19
USING MODELS TO PROJECT FUTURE CHANGES IN ATMOSPHERIC TEMPERATURES
To project the effects of increasing levels of greenhouse gases on future average global temperatures, scientists have developed complex mathematical models that simulate our current understanding of interactions among incoming sunlight, clouds, landmasses, oceans, ocean currents, concentrations of greenhouse gases and air pollutants, and other factors within the earth's complex climate system. They run these continually improving models on supercomputers and compare the results to known past climate changes, from which they project future changes in the earth's average atmospheric temperature. Figure 15.A gives a greatly simplified summary of some of the key interactions in the global climate system.
Such models provide projections of what is likely to happen to the average temperature of the lower atmosphere, based on available data and different assumptions about future changes such as CO2 and CH 4 levels in the atmosphere. How well these projections match what actually happens in the real world depends on the validity of the assumptions, what variables are built into the models, and the accuracy of the data used.
When most experts in a particular scientific field generally agree on a level of 90% certainty about a set of measurements or model results, they say that their projections are very likely to be correct; when the level of certainty reaches 95% (a rarity in science), they contend that their projections are extremely likely to be correct.
In 1990, 1995, 2001, 2007, and 2014 the IPCC published reports on how global temperatures have changed in the past (Figures 15.18 and 15.19), how they are projected to change during this century, and how such changes are likely to affect the earth's climate. According to the 2014 IPCC report, based on analysis of past climate data and the use of more than two dozen climate models, it is extremely likely (95% certainty) that human activities, especially the burning of fossil fuels, have played the dominant role in the observed atmospheric warming since 1975 (Figure 15.19). The researchers based this conclusion on the fact that, after thousands of times running the models, the only way they can get the model results to match actual measurements is by including the human activities factor (Figure 15.B).
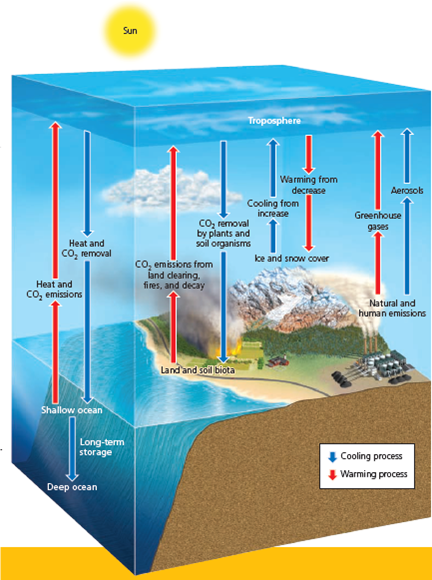
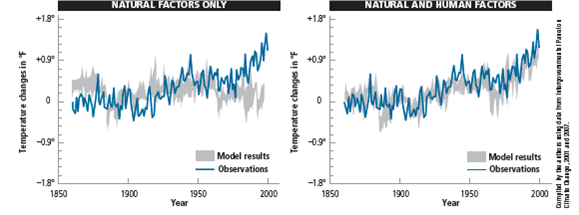
FIGURE 15.B Comparison of actual climate data with modeled projections for the period between 1860 and 2000 using natural factors only (left) and a combination of natural and human factors (right). Scientists have found that actual data match projections far more closely when human factors are included in the models.
The current results of more than two dozen climate models now in use suggest that it is very likely (with at least 90% certainty) that the earth's mean surface temperature will increase by 1.5-4.5C° (2.7-8.1F°) between 2013 and 2100 (Figure 15.C), unless we can sharply reduce deforestation along with our emissions of CO2 and other greenhouse gases. In 2014, climate researcher Michael E.
Mann reported that the latest runs of key climate models indicated that the lower limit of the 2014 IPCC projected temperature increase should be raised from 1.5C° (2.7F°) tO2.5C° (4.5F°).
While there is an extremely high degree of certainty (95%) that the atmosphere has been warming primarily due to human activities, there is also a high degree of uncertainty in climate model results about projected future changes in the average atmospheric temperature. This is indicated by the wide range of projected temperature changes in Figure 15.C and the range of the projected rise in sea level (see Figure 16, p. S48, in Supplement 5). Climate experts are working to reduce such uncertainty by learning more about how the earth's climate system works and by improving climate data and models. Despite their limitations, these models are the best and only tools that we have for projecting likely average atmospheric temperatures in coming decades.
Critical Thinking
If the highest possible projected temperature increase shown in Figure 15.C takes place, what are three major ways in which this will likely affect your lifestyle and that of any children or grandchildren you eventually might have?
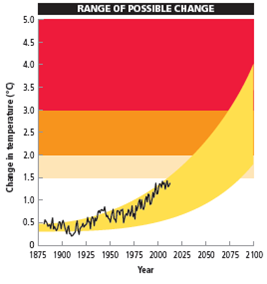
FIGURE 15.C Estimated changes (yellow area) and measured changes (black curve) in the average temperature of the atmosphere near the earth's surface between 1860 and 2013, and the projected range of temperature increase during the rest of this century.
Compiled by the authors using data from U.S. National Academy of Sciences, National Center for Atmospheric Research, Intergovernmental Panel on Climate Change, and Hadley Center for Climate Prediction and Research.
To project the effects of increasing levels of greenhouse gases on future average global temperatures, scientists have developed complex mathematical models that simulate our current understanding of interactions among incoming sunlight, clouds, landmasses, oceans, ocean currents, concentrations of greenhouse gases and air pollutants, and other factors within the earth's complex climate system. They run these continually improving models on supercomputers and compare the results to known past climate changes, from which they project future changes in the earth's average atmospheric temperature. Figure 15.A gives a greatly simplified summary of some of the key interactions in the global climate system.
Such models provide projections of what is likely to happen to the average temperature of the lower atmosphere, based on available data and different assumptions about future changes such as CO2 and CH 4 levels in the atmosphere. How well these projections match what actually happens in the real world depends on the validity of the assumptions, what variables are built into the models, and the accuracy of the data used.
When most experts in a particular scientific field generally agree on a level of 90% certainty about a set of measurements or model results, they say that their projections are very likely to be correct; when the level of certainty reaches 95% (a rarity in science), they contend that their projections are extremely likely to be correct.
In 1990, 1995, 2001, 2007, and 2014 the IPCC published reports on how global temperatures have changed in the past (Figures 15.18 and 15.19), how they are projected to change during this century, and how such changes are likely to affect the earth's climate. According to the 2014 IPCC report, based on analysis of past climate data and the use of more than two dozen climate models, it is extremely likely (95% certainty) that human activities, especially the burning of fossil fuels, have played the dominant role in the observed atmospheric warming since 1975 (Figure 15.19). The researchers based this conclusion on the fact that, after thousands of times running the models, the only way they can get the model results to match actual measurements is by including the human activities factor (Figure 15.B).
FIGURE 15.B Comparison of actual climate data with modeled projections for the period between 1860 and 2000 using natural factors only (left) and a combination of natural and human factors (right). Scientists have found that actual data match projections far more closely when human factors are included in the models.
The current results of more than two dozen climate models now in use suggest that it is very likely (with at least 90% certainty) that the earth's mean surface temperature will increase by 1.5-4.5C° (2.7-8.1F°) between 2013 and 2100 (Figure 15.C), unless we can sharply reduce deforestation along with our emissions of CO2 and other greenhouse gases. In 2014, climate researcher Michael E.
Mann reported that the latest runs of key climate models indicated that the lower limit of the 2014 IPCC projected temperature increase should be raised from 1.5C° (2.7F°) tO2.5C° (4.5F°).
While there is an extremely high degree of certainty (95%) that the atmosphere has been warming primarily due to human activities, there is also a high degree of uncertainty in climate model results about projected future changes in the average atmospheric temperature. This is indicated by the wide range of projected temperature changes in Figure 15.C and the range of the projected rise in sea level (see Figure 16, p. S48, in Supplement 5). Climate experts are working to reduce such uncertainty by learning more about how the earth's climate system works and by improving climate data and models. Despite their limitations, these models are the best and only tools that we have for projecting likely average atmospheric temperatures in coming decades.
Critical Thinking
If the highest possible projected temperature increase shown in Figure 15.C takes place, what are three major ways in which this will likely affect your lifestyle and that of any children or grandchildren you eventually might have?
FIGURE 15.C Estimated changes (yellow area) and measured changes (black curve) in the average temperature of the atmosphere near the earth's surface between 1860 and 2013, and the projected range of temperature increase during the rest of this century.
Compiled by the authors using data from U.S. National Academy of Sciences, National Center for Atmospheric Research, Intergovernmental Panel on Climate Change, and Hadley Center for Climate Prediction and Research.
Explanation Verified
Snow and ice are very important part of ...
Environmental Science 15th Edition by Scott Spoolman,Tyler Miller
Why don’t you like this exercise?
Other Minimum 8 character and maximum 255 character
Character 255


