
Campbell Biology 11th Edition by Lisa Urry,Michael Cain,Steven Wasserman,Peter Minorsky,Jane Reece
Edition 11ISBN: 978-0134093413Campbell Biology 11th Edition by Lisa Urry,Michael Cain,Steven Wasserman,Peter Minorsky,Jane Reece
Edition 11ISBN: 978-0134093413 Exercise 1
Interpreting a Scatter Plot with Two Sets of Data
Is Glucose Uptake into Cells Affected by Age Glucose, an important energy source for animals, is transported into cells by facilitated diffusion using protein carriers. In this exercise, you will interpret a graph with two sets of data from an experiment that examined glucose uptake over time in red blood cells from guinea pigs of different ages. You will determine if the cells' rate of glucose uptake depended on the age of the guinea pigs.
How the Experiment Was Done Researchers incubated guinea pig red blood cells in a 300 m M (millimolar) radioactive glucose solution at pH 7.4 at 25°C. Every 10 or 15 minutes, they removed a sample of cells and measured the concentration of radioactive glucose inside those cells. The cells came from either a 15-day-old or a 1-month-old guinea pig.
Data from the Experiment When you have multiple sets of data, it can be useful to plot them on the same graph for comparison. In the graph here, each set of dots (of the same color) forms a scatter plot , in which every data point represents two numerical values, one for each variable. For each data set, a curve that best fits the points has been drawn to make it easier to see the trends. (For additional information about graphs, see the Scientific Skills Review in Appendix F.)
Glucose Uptake over Time in Guinea Pig Red Blood Cells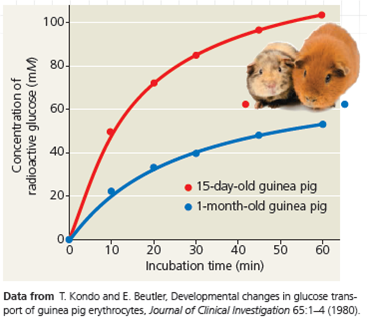
What does the graph show Compare and contrast glucose uptake in red blood cells from 15-day-old and 1-month-old guinea pigs.
Explanation Verified
The given graph clearly demonstrates tha...
Campbell Biology 11th Edition by Lisa Urry,Michael Cain,Steven Wasserman,Peter Minorsky,Jane Reece
Why don’t you like this exercise?
Other Minimum 8 character and maximum 255 character
Character 255


