
Campbell Biology 11th Edition by Lisa Urry,Michael Cain,Steven Wasserman,Peter Minorsky,Jane Reece
Edition 11ISBN: 978-0134093413Campbell Biology 11th Edition by Lisa Urry,Michael Cain,Steven Wasserman,Peter Minorsky,Jane Reece
Edition 11ISBN: 978-0134093413 Exercise 13
Does the Rate of Glucose 6-Phosphatase Activity Change over Time in Isolated Liver Cells Glucose 6-phosphatase, which is found in mammalian liver cells, is a key enzyme in control of blood glucose levels. The enzyme catalyzes the breakdown of glucose 6-phosphate into glucose and inorganic phosphate ( P i). These products are transported out of liver cells into the blood, increasing blood glucose levels. In this exercise, you will graph data from a time-course experiment that measured P i concentration in the buffer outside isolated liver cells, thus indirectly measuring glucose 6-phosphatase activity inside the cells.
How the Experiment Was Done Isolated rat liver cells were placed in a dish with buffer at physiological conditions (pH 7.4, 37°C). Glucose 6-phosphate (the substrate) was added to the dish, where it was taken up by the cells. Then a sample of buffer was removed every 5 minutes and the concentration of P i determined.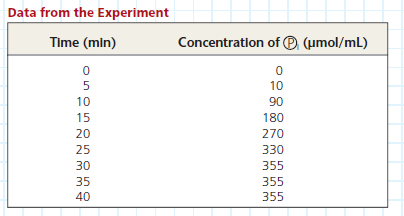
Interpret the Data
To see patterns in the data from a time-course experiment like this, it is helpful to graph the data. First, determine which set of data goes on each axis. (a) What did the researchers intentionally vary in the experiment This is the independent variable, which goes on the x- axis. (b) What are the units (abbreviated) for the independent variable Explain in words what the abbreviation stands for. (c) What was measured by the researchers This is the dependent variable, which goes on the y -axis. (d) What does the units abbreviation stand for Label each axis, including the units.
Explanation Verified
For a time course experiment, graph betw...
Campbell Biology 11th Edition by Lisa Urry,Michael Cain,Steven Wasserman,Peter Minorsky,Jane Reece
Why don’t you like this exercise?
Other Minimum 8 character and maximum 255 character
Character 255


