
Campbell Biology 11th Edition by Lisa Urry,Michael Cain,Steven Wasserman,Peter Minorsky,Jane Reece
Edition 11ISBN: 978-0134093413Campbell Biology 11th Edition by Lisa Urry,Michael Cain,Steven Wasserman,Peter Minorsky,Jane Reece
Edition 11ISBN: 978-0134093413 Exercise 3
Does the Rate of Glucose 6-Phosphatase Activity Change over Time in Isolated Liver Cells Glucose 6-phosphatase, which is found in mammalian liver cells, is a key enzyme in control of blood glucose levels. The enzyme catalyzes the breakdown of glucose 6-phosphate into glucose and inorganic phosphate ( P i). These products are transported out of liver cells into the blood, increasing blood glucose levels. In this exercise, you will graph data from a time-course experiment that measured P i concentration in the buffer outside isolated liver cells, thus indirectly measuring glucose 6-phosphatase activity inside the cells.
How the Experiment Was Done Isolated rat liver cells were placed in a dish with buffer at physiological conditions (pH 7.4, 37°C). Glucose 6-phosphate (the substrate) was added to the dish, where it was taken up by the cells. Then a sample of buffer was removed every 5 minutes and the concentration of P i determined.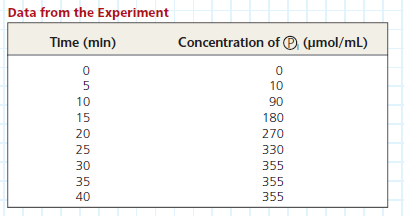
Examine your graph and look for patterns in the data. (a) Does the concentration of P i increase evenly through the course of the experiment To answer this question, describe the pattern you see in the graph. (b) What part of the graph shows the highest rate of enzyme activity Consider that the rate of enzyme activity is related to the slope of the line, y / x (the "rise" over the "run"), in mol/mL · min, with the steepest slope indicating the highest rate of enzyme activity. Calculate the rate of enzyme activity (slope) where the graph is steepest. (c) Can you think of a biological explanation for the pattern you see
Explanation Verified
To evenly space the entries, we need to ...
Campbell Biology 11th Edition by Lisa Urry,Michael Cain,Steven Wasserman,Peter Minorsky,Jane Reece
Why don’t you like this exercise?
Other Minimum 8 character and maximum 255 character
Character 255


