Campbell Biology 11th Edition by Lisa Urry,Michael Cain,Steven Wasserman,Peter Minorsky,Jane Reece
Edition 11ISBN: 978-0134093413Campbell Biology 11th Edition by Lisa Urry,Michael Cain,Steven Wasserman,Peter Minorsky,Jane Reece
Edition 11ISBN: 978-0134093413 Exercise 6
How Does DNA Content Change as Budding Yeast Cells Proceed Through Meiosis When nutrients are low, cells of the budding yeast ( Saccharomyces cerevisiae ) exit the mitotic cell cycle and enter meiosis. In this exercise you will track the DNA content of a population of yeast cells as they progress through meiosis.
How the Experiment Was Done Researchers grew a culture of yeast cells in a nutrient-rich medium and then transferred them to a nutrient-poor medium to induce meiosis. At different times after induction, the DNA content per cell was measured in a sample of the cells, and the average DNA content per cell was recorded in femtograms (fg; 1 femtogram = 1 × 10 15 gram).
Data from the Experiment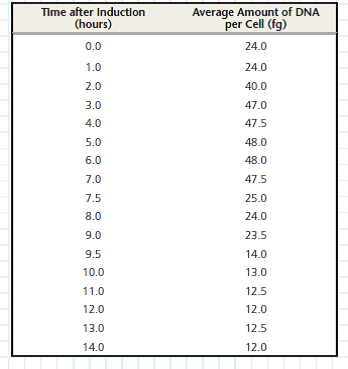
Interpret the Data
Most of the yeast cells in the culture were in G1 of the cell cycle before being moved to the nutrient-poor medium. (a) How many femtograms of DNA are there in each yeast cell in G1 Estimate this value from the data in your graph. (b) How many femtograms of DNA should be present in each cell in G2 (See Concept 9.2 and Figure 9.6.) At the end of meiosis I (MI) At the end of meiosis II (MII) (See Figure 10.7.) (c) Using these values as a guideline, distinguishthe different phases by inserting vertical dashed lines in the graph between phases and label each phase (G1, S, G2, MI, MII). You can figure out where to put the dividing lines based on what you know about the DNA content of each phase (see Figure 10.7). (d) Think carefully about the point where the line at the highest value begins to slope downward. What specific point of meiosis does this "corner" represent What stage(s) correspond to the downward sloping line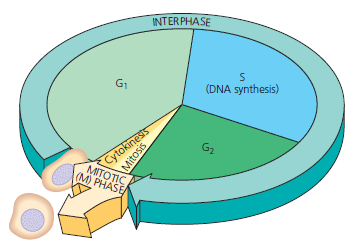
Figure 9.6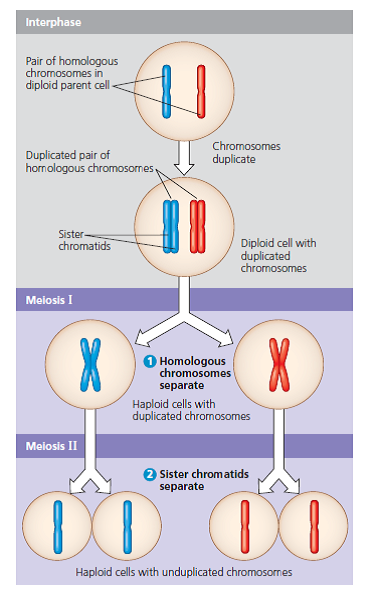
Figure 10.7
Explanation Verified
Meiosis consists of two divisions in whi...
Campbell Biology 11th Edition by Lisa Urry,Michael Cain,Steven Wasserman,Peter Minorsky,Jane Reece
Why don’t you like this exercise?
Other Minimum 8 character and maximum 255 character
Character 255


