
Campbell Biology 11th Edition by Lisa Urry,Michael Cain,Steven Wasserman,Peter Minorsky,Jane Reece
Edition 11ISBN: 978-0134093413Campbell Biology 11th Edition by Lisa Urry,Michael Cain,Steven Wasserman,Peter Minorsky,Jane Reece
Edition 11ISBN: 978-0134093413 Exercise 14
Given the Percentage Composition of One Nucleotide in a Genome, Can We Predict the Percentages of the Other Three
Nucleotides Even before the structure of DNA was elucidated, Erwin Chargaff and his coworkers noticed a pattern in the base composition of nucleotides from different species: the percentage of adenine (A) bases roughly equaled that of thymine (T) bases, and the percentage of cytosine (C) bases roughly equaled that of guanine (G) bases. Further, the percentage of each pair (A/T and C/G) varied from species to species. We now know that the 1:1 A/T and C/G ratios are due to complementary base pairing between A and T and between C and G in the DNA double helix, and interspecies differences are due to the unique sequences of bases along a DNA strand. In this exercise, you will apply Chargaff's rules to predict the composition of nucleotide bases in a genome.
How the Experiments Were Done In Chargaff's experiments, DNA was extracted from the given organism, hydrolyzed to break apart the individual nucleotides, and then analyzed chemically. These experiments provided approximate values for each type of nucleotide. (Today, whole-genome sequencing allows base composition analysis to be done more precisely directly from the sequence data.)
Data from the Experiments Tables are useful for organizing sets of data representing a common set of values (here percentages of A, G, C, and T) for a number of different samples (in this case, from different species). You can apply the patterns that you see in the known data to predict unknown values. In the table, complete base distribution data are given for sea urchin DNA and salmon DNA; you will use Chargaff's rules to fill in the rest of the table with predicted values.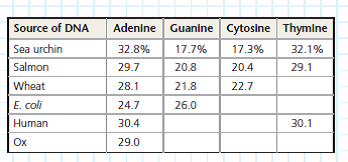
Interpret the Data
Explain how the sea urchin and salmon data demonstrate both of Chargaff's rules.
Explanation Verified
According to the Chargaff's rule, the de...
Campbell Biology 11th Edition by Lisa Urry,Michael Cain,Steven Wasserman,Peter Minorsky,Jane Reece
Why don’t you like this exercise?
Other Minimum 8 character and maximum 255 character
Character 255


