
Campbell Biology 11th Edition by Lisa Urry,Michael Cain,Steven Wasserman,Peter Minorsky,Jane Reece
Edition 11ISBN: 978-0134093413Campbell Biology 11th Edition by Lisa Urry,Michael Cain,Steven Wasserman,Peter Minorsky,Jane Reece
Edition 11ISBN: 978-0134093413 Exercise 18
How Can a Sequence Logo Be Used to Identify Ribosome Binding Sites When initiating translation, ribosomes bind to an mRNA at a ribosome binding site upstream of the 5 -AUG- 3 start codon. Because mRNAs from different genes all bind to a ribosome, the genes encoding these mRNAs are likely to have a similar base sequence where the ribosomes bind. Therefore, candidate ribosome binding sites on mRNA can be identified by comparing DNA sequences (and thus the mRNA sequences) of multiple genes in a species, searching the region upstream of the start codon for shared ("conserved") stretches of bases. In this exercise you will analyze DNA sequences from multiple such genes, represented by a visual graphic called a sequence logo.
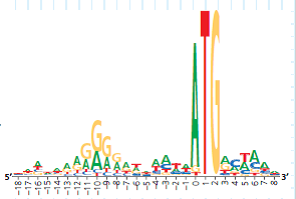
How the Experiment Was Done The DNA sequences of 149 genes from the E. coli genome were aligned and analyzed using computer software. The aim was to identify similar base sequences- at the appropriate location in each gene-as potential ribosome binding sites. Rather than presenting the data as a series of 149 sequences aligned in a column (a sequence alignment), the researchers used a sequence logo.
Data from the Experiment To show how sequence logos are made, the potential ribosome binding regions from 10 of the E. coli genes are shown in a sequence alignment, followed by the sequence logo derived from the aligned sequences. Note that the DNA shown is the nontemplate (coding) strand, which is how DNA sequences are typically presented.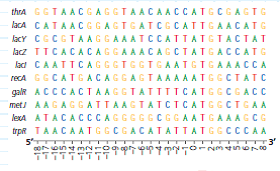
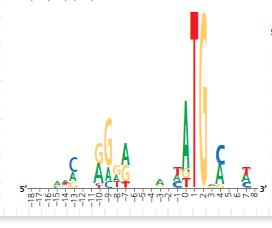
In the sequence logo (bottom, left), the horizontal axis shows the primary sequence of the DNA by nucleotide position. Letters for each base are stacked on top of each other according to their relative frequency at that position among the aligned sequences, with the most common base as the largest letter at the top of the stack. The height of each letter represents the relative frequency of that base at that position. (a) In the sequence alignment, count the number of each base at position 9 and order them from most to least frequent. Compare this to the size and placement of each base at 9 in the logo. (b) Do the same for positionS 0and 1.
How the Experiment Was Done The DNA sequences of 149 genes from the E. coli genome were aligned and analyzed using computer software. The aim was to identify similar base sequences- at the appropriate location in each gene-as potential ribosome binding sites. Rather than presenting the data as a series of 149 sequences aligned in a column (a sequence alignment), the researchers used a sequence logo.
Data from the Experiment To show how sequence logos are made, the potential ribosome binding regions from 10 of the E. coli genes are shown in a sequence alignment, followed by the sequence logo derived from the aligned sequences. Note that the DNA shown is the nontemplate (coding) strand, which is how DNA sequences are typically presented.
In the sequence logo (bottom, left), the horizontal axis shows the primary sequence of the DNA by nucleotide position. Letters for each base are stacked on top of each other according to their relative frequency at that position among the aligned sequences, with the most common base as the largest letter at the top of the stack. The height of each letter represents the relative frequency of that base at that position. (a) In the sequence alignment, count the number of each base at position 9 and order them from most to least frequent. Compare this to the size and placement of each base at 9 in the logo. (b) Do the same for positionS 0and 1.
Explanation Verified
Translation is the process of protein sy...
Campbell Biology 11th Edition by Lisa Urry,Michael Cain,Steven Wasserman,Peter Minorsky,Jane Reece
Why don’t you like this exercise?
Other Minimum 8 character and maximum 255 character
Character 255


