
Campbell Biology 11th Edition by Lisa Urry,Michael Cain,Steven Wasserman,Peter Minorsky,Jane Reece
Edition 11ISBN: 978-0134093413Campbell Biology 11th Edition by Lisa Urry,Michael Cain,Steven Wasserman,Peter Minorsky,Jane Reece
Edition 11ISBN: 978-0134093413 Exercise 3
How Can a Sequence Logo Be Used to Identify Ribosome Binding Sites When initiating translation, ribosomes bind to an mRNA at a ribosome binding site upstream of the 5 -AUG- 3 start codon. Because mRNAs from different genes all bind to a ribosome, the genes encoding these mRNAs are likely to have a similar base sequence where the ribosomes bind. Therefore, candidate ribosome binding sites on mRNA can be identified by comparing DNA sequences (and thus the mRNA sequences) of multiple genes in a species, searching the region upstream of the start codon for shared ("conserved") stretches of bases. In this exercise you will analyze DNA sequences from multiple such genes, represented by a visual graphic called a sequence logo.
How the Experiment Was Done The DNA sequences of 149 genes from the E. coli genome were aligned and analyzed using computer software. The aim was to identify similar base sequences- at the appropriate location in each gene-as potential ribosome binding sites. Rather than presenting the data as a series of 149 sequences aligned in a column (a sequence alignment), the researchers used a sequence logo.
Data from the Experiment To show how sequence logos are made, the potential ribosome binding regions from 10 of the E. coli genes are shown in a sequence alignment, followed by the sequence logo derived from the aligned sequences. Note that the DNA shown is the nontemplate (coding) strand, which is how DNA sequences are typically presented.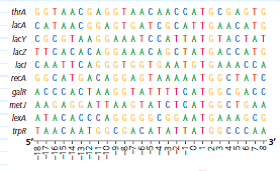
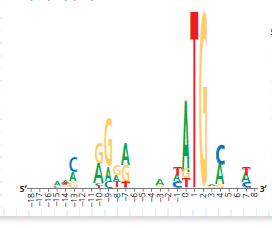
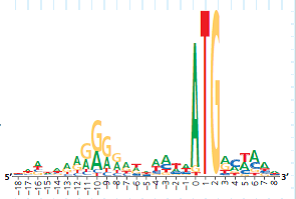
The height of a stack of letters in a logo indicates the predictive power of that stack (determined statistically). If the stack is tall, we can be more confident in predicting what base will be in that position if a new sequence is added to the logo. For example, at position 2, all 10 sequences have a G; the probability of finding a G there in a new sequence is very high, as is the stack. For short stacks, the bases all have about the same frequency, and so it's hard to predict a base at those positions. (a) Which two positions have the most predictable bases What bases do you predict would be at those positions in a newly sequenced gene (b) Which 12 positions have the least predictable bases How do you know How does this reflect the relative frequencies of the bases shown in the 10 sequences Use the two left-most positions of the 12 as examples in your answer.
How the Experiment Was Done The DNA sequences of 149 genes from the E. coli genome were aligned and analyzed using computer software. The aim was to identify similar base sequences- at the appropriate location in each gene-as potential ribosome binding sites. Rather than presenting the data as a series of 149 sequences aligned in a column (a sequence alignment), the researchers used a sequence logo.
Data from the Experiment To show how sequence logos are made, the potential ribosome binding regions from 10 of the E. coli genes are shown in a sequence alignment, followed by the sequence logo derived from the aligned sequences. Note that the DNA shown is the nontemplate (coding) strand, which is how DNA sequences are typically presented.
The height of a stack of letters in a logo indicates the predictive power of that stack (determined statistically). If the stack is tall, we can be more confident in predicting what base will be in that position if a new sequence is added to the logo. For example, at position 2, all 10 sequences have a G; the probability of finding a G there in a new sequence is very high, as is the stack. For short stacks, the bases all have about the same frequency, and so it's hard to predict a base at those positions. (a) Which two positions have the most predictable bases What bases do you predict would be at those positions in a newly sequenced gene (b) Which 12 positions have the least predictable bases How do you know How does this reflect the relative frequencies of the bases shown in the 10 sequences Use the two left-most positions of the 12 as examples in your answer.
Explanation Verified
Translation is the process of protein sy...
Campbell Biology 11th Edition by Lisa Urry,Michael Cain,Steven Wasserman,Peter Minorsky,Jane Reece
Why don’t you like this exercise?
Other Minimum 8 character and maximum 255 character
Character 255


