
Campbell Biology 11th Edition by Lisa Urry,Michael Cain,Steven Wasserman,Peter Minorsky,Jane Reece
Edition 11ISBN: 978-0134093413Campbell Biology 11th Edition by Lisa Urry,Michael Cain,Steven Wasserman,Peter Minorsky,Jane Reece
Edition 11ISBN: 978-0134093413 Exercise 7
How Can DNA Sequence Data Be Used to Track Flu Virus Evolution During Pandemic Waves
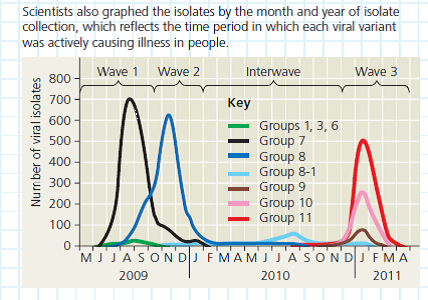
In 2009, an influenza A H1N1virus caused a pandemic, and the virus has continued to resurface in outbreaks across the world. Researchers in Taiwan were curious about why the virus kept appearing despite widespread flu vaccine initiatives. They hypothesized that newly evolved variants of the H1N1 virus were able to evade human immune system defenses. To test this hypothesis, they needed to determine if each wave of the flu infection was caused by a different H1N1 variant strain.
How the Experiment Was Done Scientists obtained the genome sequences for 4,703 virus isolates collected from patients with H1N1 flu in Taiwan. They compared the sequences in different strains for the viral hemagglutinin (HA) gene, and based on mutations that had occurred, arranged the isolates into a phylogenetic tree (see Figure 20.5 for information on how to read phylogenetic trees).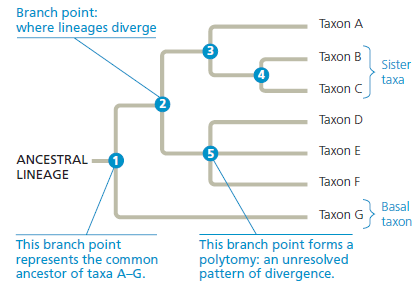
Data from the Experiment In the phylogenetic tree; each branch tip is one variant strain of the H1N1 virus with a unique HA gene sequence. The tree is a way to visualize a working hypothesis about the evolutionary relationships between H1N1 variants.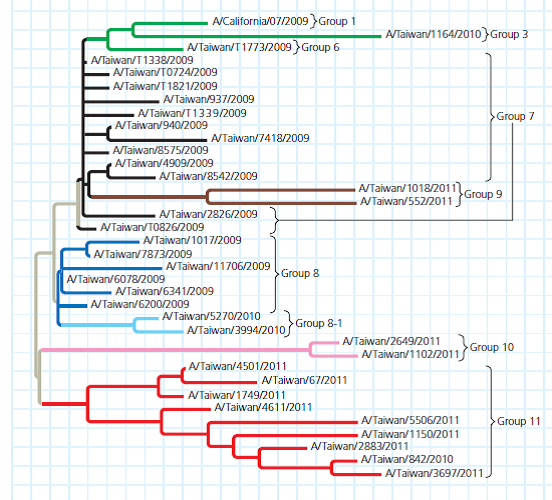
The scientists arranged the branches into groups made up of one ancestral variant and all of its descendant, mutated variants. They are color-coded in the figure. Using Group 11 as an example, trace the lineage of its variants. (a) Do all of the nodes have the same number of branches or branch tips (b) Are all of the branches in the group the same length (c) What do these results indicate
Explanation Verified
A phylogenetic tree is a diagram depicti...
Campbell Biology 11th Edition by Lisa Urry,Michael Cain,Steven Wasserman,Peter Minorsky,Jane Reece
Why don’t you like this exercise?
Other Minimum 8 character and maximum 255 character
Character 255


