
Campbell Biology 11th Edition by Lisa Urry,Michael Cain,Steven Wasserman,Peter Minorsky,Jane Reece
Edition 11ISBN: 978-0134093413Campbell Biology 11th Edition by Lisa Urry,Michael Cain,Steven Wasserman,Peter Minorsky,Jane Reece
Edition 11ISBN: 978-0134093413 Exercise 13
Using the Hardy-Weinberg Equation to Interpret Data and Make Predictions
Is Evolution Occurring in a Soybean Population One way to test whether evolution is occurring in a population is to compare the observed genotype frequencies at a locus with those expected for a non-evolving population based on the Hardy-Weinberg equation. In this exercise, you'll test whether a soybean population is evolving at a locus with two alleles, C G and C Y , that affect chlorophyll production and hence leaf color.
How the Experiment Was Done Students planted soybean seeds and then counted the number of seedlings of each genotype at day 7 and again at day 21. Seedlings of each genotype could be distinguished visually because the C G and C Y alleles show incomplete dominance: C G C G seedlings have green leaves, C G C Y seedlings have green-yellow leaves, and C Y C Y seedlings have yellow leaves.
Data from the Experiment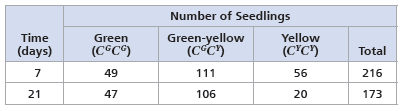
Next, use the hardy-Weinberg equation ( p 2 + 2 pq + q 2 = 1) to calculate the day 7 expected frequencies of genotypes C G C G , C G C Y , and C Y C Y for a population in hardy-Weinberg equilibrium.
Explanation

This question doesn’t have an expert verified answer yet, let Examlex AI Copilot help.
Campbell Biology 11th Edition by Lisa Urry,Michael Cain,Steven Wasserman,Peter Minorsky,Jane Reece
Why don’t you like this exercise?
Other Minimum 8 character and maximum 255 character
Character 255


