Campbell Biology 11th Edition by Lisa Urry,Michael Cain,Steven Wasserman,Peter Minorsky,Jane Reece
Edition 11ISBN: 978-0134093413Campbell Biology 11th Edition by Lisa Urry,Michael Cain,Steven Wasserman,Peter Minorsky,Jane Reece
Edition 11ISBN: 978-0134093413 Exercise 3
Using the Hardy-Weinberg Equation to Interpret Data and Make Predictions
Is Evolution Occurring in a Soybean Population One way to test whether evolution is occurring in a population is to compare the observed genotype frequencies at a locus with those expected for a nonevolving population based on the Hardy-Weinberg equation. In this exercise, you'll test whether a soybean population is evolving at a locus with two alleles, C G and C Y , that affect chlorophyll production and hence leaf color.
How the Experiment Was Done Students planted soybean seeds and then counted the number of seedlings of each genotype at day 7 and again at day 21. Seedlings of each genotype could be distinguished visually because the C G and C Y alleles show incomplete dominance: C G C G seedlings have green leaves, C G C Y seedlings have green-yellow leaves, and C Y C Y seedlings have yellow leaves.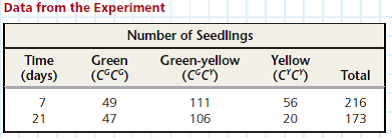
Calculate the observed frequencies of genotypes C G C G , C G C Y , and C Y C Y at day 21. Compare these frequencies to the expected frequencies calculated in step 2 and the observed frequencies at day 7. Is the seedling population in Hardy-Weinberg equilibrium at day 21, or is evolution occurring Explain your reasoning and identify which genotypes, if any, appear to be selected for or against.
Explanation Verified
Hardy-Weinberg principle is also called ...
Campbell Biology 11th Edition by Lisa Urry,Michael Cain,Steven Wasserman,Peter Minorsky,Jane Reece
Why don’t you like this exercise?
Other Minimum 8 character and maximum 255 character
Character 255


