Campbell Biology 11th Edition by Lisa Urry,Michael Cain,Steven Wasserman,Peter Minorsky,Jane Reece
Edition 11ISBN: 978-0134093413Campbell Biology 11th Edition by Lisa Urry,Michael Cain,Steven Wasserman,Peter Minorsky,Jane Reece
Edition 11ISBN: 978-0134093413 Exercise 5
Using the Hardy-Weinberg Equation to Interpret Data and Make Predictions
Is Evolution Occurring in a Soybean Population One way to test whether evolution is occurring in a population is to compare the observed genotype frequencies at a locus with those expected for a nonevolving population based on the Hardy-Weinberg equation. In this exercise, you'll test whether a soybean population is evolving at a locus with two alleles, C G and C Y , that affect chlorophyll production and hence leaf color.
How the Experiment Was Done Students planted soybean seeds and then counted the number of seedlings of each genotype at day 7 and again at day 21. Seedlings of each genotype could be distinguished visually because the C G and C Y alleles show incomplete dominance: C G C G seedlings have green leaves, C G C Y seedlings have green-yellow leaves, and C Y C Y seedlings have yellow leaves.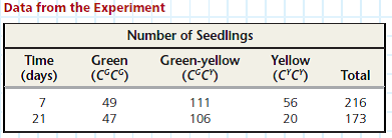
Homozygous C Y C Y individuals cannot produce chlorophyll. The ability to photosynthesize becomes more critical as seedlings age and begin to exhaust the supply of food that was stored in the seed from which they emerged. Develop a hypothesis that explains the data for days 7 and 21. Based on this hypothesis, predict how the frequencies of the C G and C Y alleles will change beyond day 21.
Explanation Verified
Alternative form of same gene or same ge...
Campbell Biology 11th Edition by Lisa Urry,Michael Cain,Steven Wasserman,Peter Minorsky,Jane Reece
Why don’t you like this exercise?
Other Minimum 8 character and maximum 255 character
Character 255


