
Living in the Environment 18th Edition by Tyler Miller,Scott Spoolman
Edition 18ISBN: 9781285969725Living in the Environment 18th Edition by Tyler Miller,Scott Spoolman
Edition 18ISBN: 9781285969725 Exercise 8
Use the graph below, comparing U.S. oil consumption, production, and imports, to answer the questions that follow.
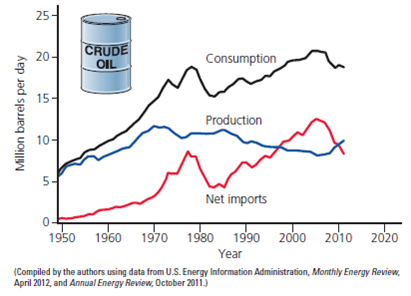
By what percentage did U.S. net oil imports decrease between 2005 and 2011
What general conclusions can you draw from these data Compare notes and discuss your conclusions with your classmates.
By what percentage did U.S. net oil imports decrease between 2005 and 2011
What general conclusions can you draw from these data Compare notes and discuss your conclusions with your classmates.
Explanation Verified
In 2005, net imports was around 13 milli...
Living in the Environment 18th Edition by Tyler Miller,Scott Spoolman
Why don’t you like this exercise?
Other Minimum 8 character and maximum 255 character
Character 255


