
Living in the Environment 18th Edition by Tyler Miller,Scott Spoolman
Edition 18ISBN: 9781285969725Living in the Environment 18th Edition by Tyler Miller,Scott Spoolman
Edition 18ISBN: 9781285969725 Exercise 3
In 2006, scientists assessed the overall condition of the estuaries on the western coasts of the U.S. states of Oregon and Washington. To do so, they took measurements of various characteristics of the water, including dissolved oxygen (DO), in selected locations within the estuaries. The concentration of DO for each site was measured in terms of milligrams (mg) of oxygen per liter (L) of water sampled. The scientists used the following DO concentration ranges and quality categories to rate their water samples: water with greater than 5 mg/L of DO was considered good for supporting aquatic life; water with 2 to 5 mg/L of DO was rated as fair; and water with less than 2 mg/L of DO was rated as poor.
The following graph shows measurements taken in bottom water at 242 locations. Each triangle mark represents one or more measurements. The x-axis on this graph represents DO concentrations in mg/L. The y-axis represents percentages of the total area of estuaries studied (estuarine area).
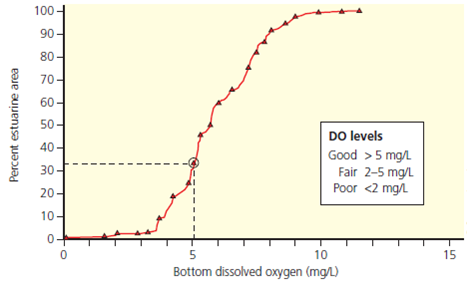
To read this graph, pick one of the triangles and observe the values on the x- and y-axes. For example, note that the circled triangle lines up approximately with the 5-mg/L mark on the x-axis and with a value of about 34% on the y-axis. This means that waters at this particular measurement station (or stations), along with about 34% of the total area being studied, are estimated to have a 5% or lower DO concentration.
Use this information, along with the graph, to answer the following questions:
Approximately what percentage of the estuarine area studied is considered to have poor DO levels About what percentage has fair DO levels, and about what percentage has good DO levels
The following graph shows measurements taken in bottom water at 242 locations. Each triangle mark represents one or more measurements. The x-axis on this graph represents DO concentrations in mg/L. The y-axis represents percentages of the total area of estuaries studied (estuarine area).
To read this graph, pick one of the triangles and observe the values on the x- and y-axes. For example, note that the circled triangle lines up approximately with the 5-mg/L mark on the x-axis and with a value of about 34% on the y-axis. This means that waters at this particular measurement station (or stations), along with about 34% of the total area being studied, are estimated to have a 5% or lower DO concentration.
Use this information, along with the graph, to answer the following questions:
Approximately what percentage of the estuarine area studied is considered to have poor DO levels About what percentage has fair DO levels, and about what percentage has good DO levels
Explanation Verified
The area having less than 2 mg/L of DO c...
Living in the Environment 18th Edition by Tyler Miller,Scott Spoolman
Why don’t you like this exercise?
Other Minimum 8 character and maximum 255 character
Character 255


