
Living in the Environment 18th Edition by Tyler Miller,Scott Spoolman
Edition 18ISBN: 9781285969725Living in the Environment 18th Edition by Tyler Miller,Scott Spoolman
Edition 18ISBN: 9781285969725 Exercise 14
Use this graph to compare the per capita gross domestic product (GDP) with the per capita genuine progress indicator (GPI) in the United States between 1950 and 2004 (the latest year for which this data is available).
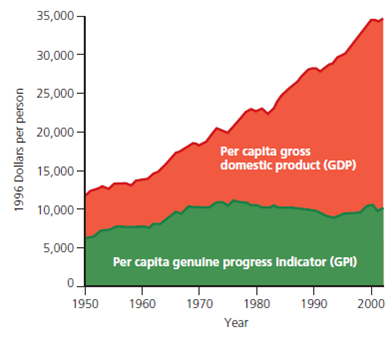
(a) By what percentage did the per capita GDP increase between 1950 and 1975, and between 1975 and 2004 (b) By what percentage did the per capita GPI increase between 1950 and 1975, and decrease between 1975 and 2004
(a) By what percentage did the per capita GDP increase between 1950 and 1975, and between 1975 and 2004 (b) By what percentage did the per capita GPI increase between 1950 and 1975, and decrease between 1975 and 2004
Explanation Verified
a)
Therefore, percentage of per capita G...
Living in the Environment 18th Edition by Tyler Miller,Scott Spoolman
Why don’t you like this exercise?
Other Minimum 8 character and maximum 255 character
Character 255


