
Essentials of Business Analytics 1st Edition by Jeffrey Camm,James Cochran,Michael Fry,Jeffrey Ohlmann ,David Anderson
Edition 1ISBN: 978-1285187273Essentials of Business Analytics 1st Edition by Jeffrey Camm,James Cochran,Michael Fry,Jeffrey Ohlmann ,David Anderson
Edition 1ISBN: 978-1285187273 Exercise 2
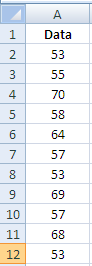
Consider a sample with data values of 53, 55, 70, 58, 64, 57, 53, 69, 57, 68, and 53. Compute the mean, median, and mode.
Explanation Verified
Consider the data in Excel as shown below:
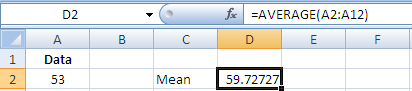
 To calculate the mean in Excel, use function
 as shown below:
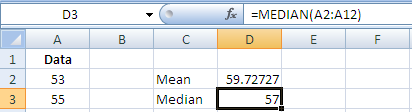
 To calculate the median in Excel, use function
 as shown below:
 Mode is that value which occurs most frequently in the given data. To calculate the mode in Excel, use function
 as shown below:
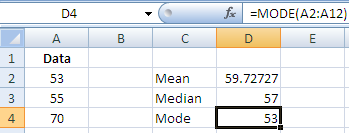 Hence, for the given data, the respective mean, median and mode is
 .
.
To calculate the mean in Excel, use function as shown below: To calculate the median in Excel, use function as shown below: Mode is that value which occurs most frequently in the given data. To calculate the mode in Excel, use function as shown below: Hence, for the given data, the respective mean, median and mode is .Essentials of Business Analytics 1st Edition by Jeffrey Camm,James Cochran,Michael Fry,Jeffrey Ohlmann ,David Anderson
Why don’t you like this exercise?
Other Minimum 8 character and maximum 255 character
Character 255


