
Essentials of Business Analytics 1st Edition by Jeffrey Camm,James Cochran,Michael Fry,Jeffrey Ohlmann ,David Anderson
Edition 1ISBN: 978-1285187273Essentials of Business Analytics 1st Edition by Jeffrey Camm,James Cochran,Michael Fry,Jeffrey Ohlmann ,David Anderson
Edition 1ISBN: 978-1285187273 Exercise 13
The following 20 observations are for two quantitative variables, x and y.
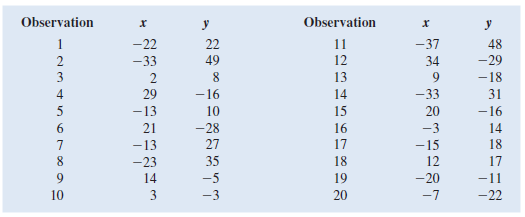
a. Create a scatter chart for these 20 observations.
b. Fit a linear trendline to the 20 observations. What can you say about the relationship between the two quantitative variables
a. Create a scatter chart for these 20 observations.
b. Fit a linear trendline to the 20 observations. What can you say about the relationship between the two quantitative variables
Explanation Verified
a.Consider the following table:
![]() A scat...
A scat...
Essentials of Business Analytics 1st Edition by Jeffrey Camm,James Cochran,Michael Fry,Jeffrey Ohlmann ,David Anderson
Why don’t you like this exercise?
Other Minimum 8 character and maximum 255 character
Character 255


