
Essentials of Business Analytics 1st Edition by Jeffrey Camm,James Cochran,Michael Fry,Jeffrey Ohlmann ,David Anderson
Edition 1ISBN: 978-1285187273Essentials of Business Analytics 1st Edition by Jeffrey Camm,James Cochran,Michael Fry,Jeffrey Ohlmann ,David Anderson
Edition 1ISBN: 978-1285187273 Exercise 15
The International Organization of Motor Vehicle Manufacturers (officially known as the Organisation Internationale des Constructeurs d'Automobiles, OICA) provides data on worldwide vehicle production by manufacturer. The following table shows vehicle production
numbers for four different manufacturers for five recent years. Data are in millions of vehicles.
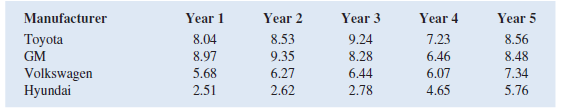
a. Construct a line chart for the time series data for years 1 through 5 showing the number of vehicles manufactured by each automotive company. Show the time series for all four manufacturers on the same graph.
b. What does the line chart indicate about vehicle production amounts between years 1 through 5 Discuss.
c. Construct a clustered bar chart showing vehicles produced by automobile manufacturer using the years 1 through 5 data. Represent the years of production along the horizontal axis, and cluster the production amounts for the four manufacturers in each year. Which company is the leading manufacturer in each year
numbers for four different manufacturers for five recent years. Data are in millions of vehicles.
a. Construct a line chart for the time series data for years 1 through 5 showing the number of vehicles manufactured by each automotive company. Show the time series for all four manufacturers on the same graph.
b. What does the line chart indicate about vehicle production amounts between years 1 through 5 Discuss.
c. Construct a clustered bar chart showing vehicles produced by automobile manufacturer using the years 1 through 5 data. Represent the years of production along the horizontal axis, and cluster the production amounts for the four manufacturers in each year. Which company is the leading manufacturer in each year
Explanation Verified
Enter the vehicle production numbers in ...
Essentials of Business Analytics 1st Edition by Jeffrey Camm,James Cochran,Michael Fry,Jeffrey Ohlmann ,David Anderson
Why don’t you like this exercise?
Other Minimum 8 character and maximum 255 character
Character 255


