
Essentials of Business Analytics 1st Edition by Jeffrey Camm,James Cochran,Michael Fry,Jeffrey Ohlmann ,David Anderson
Edition 1ISBN: 978-1285187273Essentials of Business Analytics 1st Edition by Jeffrey Camm,James Cochran,Michael Fry,Jeffrey Ohlmann ,David Anderson
Edition 1ISBN: 978-1285187273 Exercise 21
Consider the following survey results regarding smartphone ownership by age:
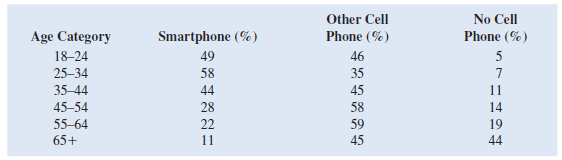
a. Construct a stacked column chart to display the survey data on type of mobile phone ownership. Use Age Category as the variable on the horizontal axis.
b. Construct a clustered column chart to display the survey data. Use Age Category as the variable on the horizontal axis.
c. What can you infer about the relationship between age and smartphone ownership from the column charts in parts a and b Which column chart (stacked or clustered) is best for interpreting this relationship Why
Explanation Verified
a.Consider the following data set regard...
Essentials of Business Analytics 1st Edition by Jeffrey Camm,James Cochran,Michael Fry,Jeffrey Ohlmann ,David Anderson
Why don’t you like this exercise?
Other Minimum 8 character and maximum 255 character
Character 255


