
Essentials of Business Analytics 1st Edition by Jeffrey Camm,James Cochran,Michael Fry,Jeffrey Ohlmann ,David Anderson
Edition 1ISBN: 978-1285187273Essentials of Business Analytics 1st Edition by Jeffrey Camm,James Cochran,Michael Fry,Jeffrey Ohlmann ,David Anderson
Edition 1ISBN: 978-1285187273 Exercise 23
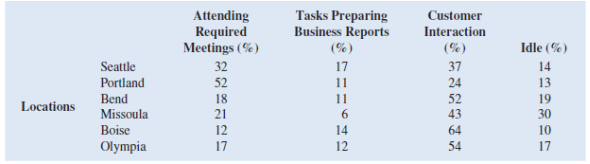
The Northwest regional manager of Logan Outdoor Equipment Company has conducted a study to determine how her store managers are allocating their time. A study was undertaken over three weeks that collected the following data related to the percentage of time each store manager spent on the tasks of attending required meetings, preparing business reports, customer interaction, and being idle. The results of the data collection appear in the following table:
a. Create a stacked bar chart with locations along the vertical axis. Reformat the bar chart to best display these data by adding axis labels, a chart title, and so on.
b. Create a clustered bar chart with locations along the vertical axis and clusters of tasks. Reformat the bar chart to best display these data by adding axis labels, a chart title, and the like.
c. Create multiple bar charts where each location becomes a single bar chart showing the percentage of time spent on tasks. Reformat the bar charts to best display these data by adding axes labels, a chart title, and so forth.
d. Which form of bar chart (stacked, clustered, or multiple) is preferable for these data Why
e. What can we infer about the differences among how store managers are allocating their time at the different locations
Explanation Verified
a.Consider the following data set:
![]() To ...
To ...
Essentials of Business Analytics 1st Edition by Jeffrey Camm,James Cochran,Michael Fry,Jeffrey Ohlmann ,David Anderson
Why don’t you like this exercise?
Other Minimum 8 character and maximum 255 character
Character 255


