
Essentials of Business Analytics 1st Edition by Jeffrey Camm,James Cochran,Michael Fry,Jeffrey Ohlmann ,David Anderson
Edition 1ISBN: 978-1285187273Essentials of Business Analytics 1st Edition by Jeffrey Camm,James Cochran,Michael Fry,Jeffrey Ohlmann ,David Anderson
Edition 1ISBN: 978-1285187273 Exercise 25
The Ajax Company uses a portfolio approach to manage their research and development (R D) projects. Ajax wants to keep a mix of projects to balance the expected return and risk profiles of their R D activities. Consider the situation where Ajax has six R D projects as characterized in the table. Each project is given an expected rate of return and a risk assessment, which is a value between 1 and 10 where 1 is the least risky and 10 is the most risky. Ajax would like to visualize their current R D projects to keep track of the overall risk and return of their R D portfolio.
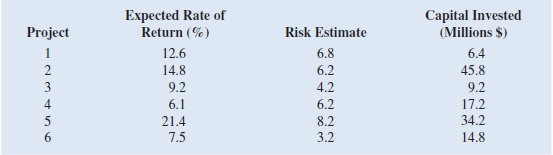
a. Create a bubble chart where the expected rate of return is along the horizontal axis, the risk estimate is on the vertical axis, and the size of the bubbles represents the amount of capital invested. Format this chart for best presentation by adding axes labels and labeling each bubble with the project number.
b. The efficient frontier of R D projects represents the set of projects that have the highest expected rate of return for a given level of risk. In other words, any project that has a smaller expected rate of return for an equivalent, or higher, risk estimate cannot be on the efficient frontier. From the bubble chart in part a., what projects appear to be located on the efficient frontier
Explanation Verified
Enter the available data in Excel as sho...
Essentials of Business Analytics 1st Edition by Jeffrey Camm,James Cochran,Michael Fry,Jeffrey Ohlmann ,David Anderson
Why don’t you like this exercise?
Other Minimum 8 character and maximum 255 character
Character 255


