
Essentials of Business Analytics 1st Edition by Jeffrey Camm,James Cochran,Michael Fry,Jeffrey Ohlmann ,David Anderson
Edition 1ISBN: 978-1285187273Essentials of Business Analytics 1st Edition by Jeffrey Camm,James Cochran,Michael Fry,Jeffrey Ohlmann ,David Anderson
Edition 1ISBN: 978-1285187273 Exercise 4
The following table shows monthly revenue for six different web development companies.
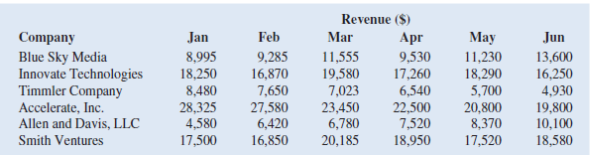
a. Use Excel to create sparklines for sales at each company.
b. Which companies have generally decreasing revenues over the six months Which company has exhibited the most consistent growth over the six months Which companies have revenues that are both increasing and decreasing over the six months
c. Use Excel to create a heat map for the revenue of the six companies. Do you find the heat map or the sparklines to be better at communicating the trend of revenues over the six months for each company Why
Explanation Verified
The following table shows monthly revenu...
Essentials of Business Analytics 1st Edition by Jeffrey Camm,James Cochran,Michael Fry,Jeffrey Ohlmann ,David Anderson
Why don’t you like this exercise?
Other Minimum 8 character and maximum 255 character
Character 255


