
Essentials of Business Analytics 1st Edition by Jeffrey Camm,James Cochran,Michael Fry,Jeffrey Ohlmann ,David Anderson
Edition 1ISBN: 978-1285187273Essentials of Business Analytics 1st Edition by Jeffrey Camm,James Cochran,Michael Fry,Jeffrey Ohlmann ,David Anderson
Edition 1ISBN: 978-1285187273 Exercise 15
A sociologist was hired by a large city hospital to investigate the relationship between the number of unauthorized days that employees are absent per year and the distance (miles) between home and work for the employees. A sample of 10 employees was chosen, and
the following data were collected.
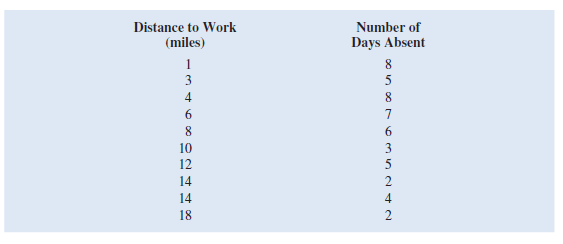
a. Develop a scatter chart for these data. Does a linear relationship appear reasonable Explain.
b. Use the data to develop an estimated regression equation that could be used to predict the number of days absent given the distance to work. What is the estimated regression model
c. What is the 99 percent confidence interval for the regression parameter
 Based on this interval, what conclusion can you make about the hypotheses that the regression parameter
 is equal to zero
d. What is the 99 percent confidence interval for the regression parameter
 Based on this interval, what conclusion can you make about the hypotheses that the regression parameter
 is equal to zero
e. How much of the variation in the sample values of number of days absent does the model you estimated in part b explain
the following data were collected.
a. Develop a scatter chart for these data. Does a linear relationship appear reasonable Explain.
b. Use the data to develop an estimated regression equation that could be used to predict the number of days absent given the distance to work. What is the estimated regression model
c. What is the 99 percent confidence interval for the regression parameter
Based on this interval, what conclusion can you make about the hypotheses that the regression parameter is equal to zero d. What is the 99 percent confidence interval for the regression parameter
Based on this interval, what conclusion can you make about the hypotheses that the regression parameter is equal to zero e. How much of the variation in the sample values of number of days absent does the model you estimated in part b explain
Explanation Verified
Consider the provided details and the "A...
Essentials of Business Analytics 1st Edition by Jeffrey Camm,James Cochran,Michael Fry,Jeffrey Ohlmann ,David Anderson
Why don’t you like this exercise?
Other Minimum 8 character and maximum 255 character
Character 255


