
Essentials of Business Analytics 1st Edition by Jeffrey Camm,James Cochran,Michael Fry,Jeffrey Ohlmann ,David Anderson
Edition 1ISBN: 978-1285187273Essentials of Business Analytics 1st Edition by Jeffrey Camm,James Cochran,Michael Fry,Jeffrey Ohlmann ,David Anderson
Edition 1ISBN: 978-1285187273 Exercise 21
The Toyota Camry is one of the best-selling cars in North America. The cost of a previously owned Camry depends on many factors, including the model year, mileage, and condition. To investigate the relationship between the car's mileage and the sales price for Camrys, the following data show the mileage and sale price for 19 sales (PriceHub Web site, February 24, 2012).
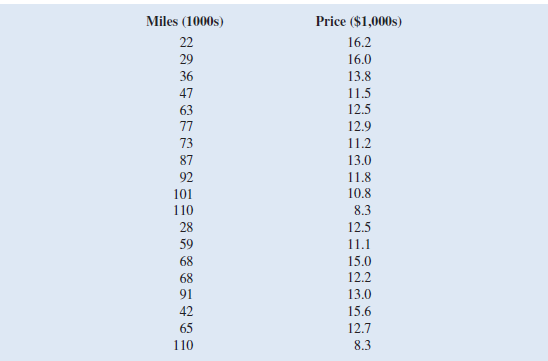
a. Develop a scatter chart for these data with miles as the independent variable. What does the scatter chart indicate about the relationship between price and miles
b. Develop an estimated regression equation showing how price is related to miles. What is the estimated regression model
c. Test whether each of the regression parameters b 0 and b 1 is equal to zero at a 0.01 level of significance. What are the correct interpretations of the estimated regression parameters Are these interpretations reasonable
d. How much of the variation in the sample values of price does the model estimated in part b explain
e. For the model estimated in part b, calculate the predicted price and residual for each automobile in the data. Identify the two automobiles that were the biggest bargains.
f. Suppose that you are considering purchasing a previously owned Camry that has been driven 60,000 miles. Use the estimated regression equation developed in part b to predict the price for this car. Is this the price you would offer the seller
Explanation Verified
Consider the provided details and the "C...
Essentials of Business Analytics 1st Edition by Jeffrey Camm,James Cochran,Michael Fry,Jeffrey Ohlmann ,David Anderson
Why don’t you like this exercise?
Other Minimum 8 character and maximum 255 character
Character 255


