
Essentials of Business Analytics 1st Edition by Jeffrey Camm,James Cochran,Michael Fry,Jeffrey Ohlmann ,David Anderson
Edition 1ISBN: 978-1285187273Essentials of Business Analytics 1st Edition by Jeffrey Camm,James Cochran,Michael Fry,Jeffrey Ohlmann ,David Anderson
Edition 1ISBN: 978-1285187273 Exercise 11
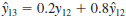
With a smoothing constant of a 5 0.2, equation (5.7) shows that the forecast for week 13 of the gasoline sales data from Table 5.1 is given by
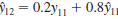
 . However, the forecast for week 12 is given by
 Thus, we could combine these two results to show that the forecast for week 13 can be written

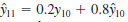
a. Making use of the fact that
 (and similarly for
 ), continue to expand the expression for y ^13 until it is written in terms of the past data values y 12, y 11, y 10, y 9, y 8, and the forecast for period 8,
 .
.
b. Refer to the coefficients or weights for the past values y 12, y 11, y 10, y 9, y 8. What observation can you make about how exponential smoothing weights past data values in arriving at new forecasts Compare this weighting pattern with the weighting pattern of the moving averages method.
. However, the forecast for week 12 is given by Thus, we could combine these two results to show that the forecast for week 13 can be written a. Making use of the fact that
(and similarly for ), continue to expand the expression for y ^13 until it is written in terms of the past data values y 12, y 11, y 10, y 9, y 8, and the forecast for period 8, .b. Refer to the coefficients or weights for the past values y 12, y 11, y 10, y 9, y 8. What observation can you make about how exponential smoothing weights past data values in arriving at new forecasts Compare this weighting pattern with the weighting pattern of the moving averages method.
Explanation Verified
According to the provided details, the s...
Essentials of Business Analytics 1st Edition by Jeffrey Camm,James Cochran,Michael Fry,Jeffrey Ohlmann ,David Anderson
Why don’t you like this exercise?
Other Minimum 8 character and maximum 255 character
Character 255


