
Essentials of Business Analytics 1st Edition by Jeffrey Camm,James Cochran,Michael Fry,Jeffrey Ohlmann ,David Anderson
Edition 1ISBN: 978-1285187273Essentials of Business Analytics 1st Edition by Jeffrey Camm,James Cochran,Michael Fry,Jeffrey Ohlmann ,David Anderson
Edition 1ISBN: 978-1285187273 Exercise 10
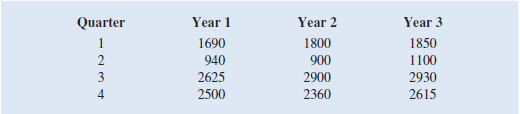
The quarterly sales data (number of copies sold) for a college textbook over the past three years follow:
a. Construct a time series plot. What type of pattern exists in the data
b. Use a regression model with dummy variables as follows to develop an equation to account for seasonal effects in the data. Qtr1 5 1 if quarter 1, 0 otherwise; Qtr2 5 1 if quarter 2, 0 otherwise; Qtr3 5 1 if quarter 3, 0 otherwise.
c. Based on the model you developed in part b, compute the quarterly forecasts for next year.
d. Let t 5 1 to refer to the observation in quarter 1 of year 1; t 5 2 to refer to the observation in quarter 2 of year 1; … and t 5 12 to refer to the observation in quarter 4 of year 3. Using the dummy variables defined in part b and t , develop an equation to account for seasonal effects and any linear trend in the time series.
e. Based upon the seasonal effects in the data and linear trend, compute the quarterly forecasts for next year.
f. Is the model you developed in part b or the model you developed in part d more effective Justify your answer.
Explanation Verified
Consider the provided details and the da...
Essentials of Business Analytics 1st Edition by Jeffrey Camm,James Cochran,Michael Fry,Jeffrey Ohlmann ,David Anderson
Why don’t you like this exercise?
Other Minimum 8 character and maximum 255 character
Character 255


