
Essentials of Business Analytics 1st Edition by Jeffrey Camm,James Cochran,Michael Fry,Jeffrey Ohlmann ,David Anderson
Edition 1ISBN: 978-1285187273Essentials of Business Analytics 1st Edition by Jeffrey Camm,James Cochran,Michael Fry,Jeffrey Ohlmann ,David Anderson
Edition 1ISBN: 978-1285187273 Exercise 14
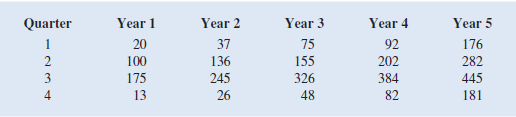
South Shore Construction builds permanent docks and seawalls along the southern shore of Long Island, New York. Although the firm has been in business only five years, revenue has increased from $308,000 in the first year of operation to $1,084,000 in the most recent year. The following data show the quarterly sales revenue in thousands of dollars:
a. Construct a time series plot. What type of pattern exists in the data
b. Use a multiple regression model with dummy variables as follows to develop an equation to account for seasonal effects in the data. Qtr1 5 1 if quarter 1, 0 otherwise; Qtr2 5 1 if quarter 2, 0 otherwise; Qtr3 5 1 if quarter 3, 0 otherwise.
c. Based on the model you developed in part b, compute estimates of quarterly sales for year 6.
d. Let Period 5 1 refer to the observation in quarter 1 of year 1; Period 5 2 refer to the observation in quarter 2 of year 1; … and Period 5 20 refer to the observation in quarter 4 of year 5. Using the dummy variables defined in part b and the variable Period, develop an equation to account for seasonal effects and any linear trend in the time series.
e. Based upon the seasonal effects in the data and linear trend estimated in part c, compute estimates of quarterly sales for year 6.
f. Is the model you developed in part b or the model you developed in part d more effective Justify your answer.
Explanation Verified
Consider the provided details and the da...
Essentials of Business Analytics 1st Edition by Jeffrey Camm,James Cochran,Michael Fry,Jeffrey Ohlmann ,David Anderson
Why don’t you like this exercise?
Other Minimum 8 character and maximum 255 character
Character 255


