Bioprocess Engineering 2nd Edition by Fikret Kargi,Michael Shuler
Edition 2ISBN: 9780130819086Bioprocess Engineering 2nd Edition by Fikret Kargi,Michael Shuler
Edition 2ISBN: 9780130819086 Exercise 8
a. Estimate the required cooling-water flow rate for a 100,000-l fermenter with an 80,000-l
working volume when the rate of oxygen consumption is 100 mmol
 The desired
operating temperature is 35°C. A cooling coil is to be used. The minimum allowable tem-
perature differential between the cooling water and the broth is 5°C. Cooling water is
available at 15°C. The heat capacities of the broth and the cooling water are roughly
equal.
b. Estimate the required length of cooling coil if the coil has a 2.5-cm diameter and the over-
all heat transfer coefficient is

Example 10.4.†
As fermenters are scaled up, the mixing time usually increases. Mixing time,
 , can be defined as the time it takes for the concentration of a compound to return to 95of the equilib- Adapted from J. Jost, Chapter 3 in S. L. Sandler and B. A. Finlayson, eds., Chemical Engineering Education in a Changing Environment, Engineering Foundation, New York, 1988
rium value after a local perturbation in its concentration. Mixing times are experimentally determinable by step addition of an electrolyte. The conductivity can be measured continuously
at various locations distant from the injection site.
A production fermenter usually contains multiple impellers. An effective modeling approach is to divide the contents of the large tank into mixing compartments, where each compartment is perfectly mixed. As indicated in Fig. 10.9,
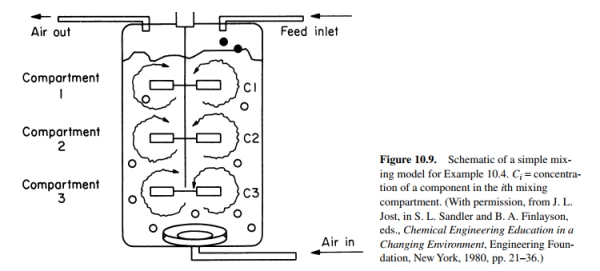
a simple model is to consider that a
separate compartment is associated with each impeller. In this problem, we let H be the overall mass transfer coefficient between compartments. The transient mass balances and experimental data can be used to estimate a value of H.
Consider the case where H has been determined to be 0.43
 for a 10 l vessel and
 for a 10,000 l vessel. With E. coli fermentations, glucose feed rates in a fed batch
are adjusted to maintain a constant, relatively low concentration of glucose to prevent the formation of toxic metabolites (e.g., acetate) that would limit the ultimate cell concentration.
Assume that the desired glucose concentration is 25 mg/l and that the Monod kinetics can be
approximated as first order with a rate constant of about 0.05
 Assume the cell concentration changes slowly. Assume that the glucose supplemental feed is sufficiently concentrated
that the total fluid volume in the reactor is constant. Also, assume that F, the mass addition
rate of glucose per unit reactor volume, changes slowly in comparison to the characteristic
mixing and reaction times. Compare the variation in glucose concentrations in the small and
large tanks when an ideal probe (no error or lag in measurement) is used to maintain the
set-point concentration at 25 mg/l in the middle compartment. Consider the response if the
probe is placed in the top compartment instead of the middle compartment.
working volume when the rate of oxygen consumption is 100 mmol
The desiredoperating temperature is 35°C. A cooling coil is to be used. The minimum allowable tem-
perature differential between the cooling water and the broth is 5°C. Cooling water is
available at 15°C. The heat capacities of the broth and the cooling water are roughly
equal.
b. Estimate the required length of cooling coil if the coil has a 2.5-cm diameter and the over-
all heat transfer coefficient is
Example 10.4.†
As fermenters are scaled up, the mixing time usually increases. Mixing time,
, can be defined as the time it takes for the concentration of a compound to return to 95of the equilib- Adapted from J. Jost, Chapter 3 in S. L. Sandler and B. A. Finlayson, eds., Chemical Engineering Education in a Changing Environment, Engineering Foundation, New York, 1988rium value after a local perturbation in its concentration. Mixing times are experimentally determinable by step addition of an electrolyte. The conductivity can be measured continuously
at various locations distant from the injection site.
A production fermenter usually contains multiple impellers. An effective modeling approach is to divide the contents of the large tank into mixing compartments, where each compartment is perfectly mixed. As indicated in Fig. 10.9,
a simple model is to consider that a
separate compartment is associated with each impeller. In this problem, we let H be the overall mass transfer coefficient between compartments. The transient mass balances and experimental data can be used to estimate a value of H.
Consider the case where H has been determined to be 0.43
for a 10 l vessel and for a 10,000 l vessel. With E. coli fermentations, glucose feed rates in a fed batchare adjusted to maintain a constant, relatively low concentration of glucose to prevent the formation of toxic metabolites (e.g., acetate) that would limit the ultimate cell concentration.
Assume that the desired glucose concentration is 25 mg/l and that the Monod kinetics can be
approximated as first order with a rate constant of about 0.05
Assume the cell concentration changes slowly. Assume that the glucose supplemental feed is sufficiently concentratedthat the total fluid volume in the reactor is constant. Also, assume that F, the mass addition
rate of glucose per unit reactor volume, changes slowly in comparison to the characteristic
mixing and reaction times. Compare the variation in glucose concentrations in the small and
large tanks when an ideal probe (no error or lag in measurement) is used to maintain the
set-point concentration at 25 mg/l in the middle compartment. Consider the response if the
probe is placed in the top compartment instead of the middle compartment.
Explanation Verified
The working volume of the of the ferment...
Bioprocess Engineering 2nd Edition by Fikret Kargi,Michael Shuler
Why don’t you like this exercise?
Other Minimum 8 character and maximum 255 character
Character 255


