Deck 13: Linear Regression and Correlation
Full screen (f)
Question
Question
Question
Question
Question
Question
Question
Question
Question
Question
Question
Question
Question
Question
Question
Question
Question
Question
Question
Question
Question
Question
Question
Question
Question
Question
Question
Question
When testing the strength of the relationship between two variables,the alternate hypothesis is: 
Question
In regression analysis,we expect prediction error or (  - Y)does not equal zero.
- Y)does not equal zero. Question
Question
Question
Question
Question
Question
Question
Question
Question
Question
Question
When testing the strength of the relationship between two variables,the null hypothesis is: 
Question
Question
Question
Question
Question
Question
Question
Question
Question
Question
Question
Question
Question
Question
Question
Question
Question
Question
Question
Question
Question
Assume the least squares equation is  = 10 + 20X.What does the value of 10 in the equation indicate?
A)Y intercept
B)For each unit increased in Y,X increases by 10
C)For each unit increased in X,Y increases by 10
D)None of these
= 10 + 20X.What does the value of 10 in the equation indicate?A)Y intercept
B)For each unit increased in Y,X increases by 10
C)For each unit increased in X,Y increases by 10
D)None of these
Question
Question
In regression,the difference between the confidence interval and prediction interval formulas is
A)the prediction interval is the square root of the confidence interval.
B)the addition of "1" to the quantity under the radical sign.
C)the prediction interval uses and the confidence interval uses r.
D)no difference.
A)the prediction interval is the square root of the confidence interval.
B)the addition of "1" to the quantity under the radical sign.
C)the prediction interval uses
and the confidence interval uses r.D)no difference.
Question
Question
Which of the following is true about the standard error of estimate?
A)It is a measure of the accuracy of the prediction
B)It is based on squared vertical deviations between Y and
C)It cannot be negative
D)All of these
A)It is a measure of the accuracy of the prediction
B)It is based on squared vertical deviations between Y and
C)It cannot be negative
D)All of these
Question
Question
Question
In the least squares equation,  = 10 + 20X the value of 20 indicates
A)the Y intercept.
B)for each unit increase in X,Y increases by 20.
C)for each unit increase in Y,X increases by 20.
D)none of these.
= 10 + 20X the value of 20 indicatesA)the Y intercept.
B)for each unit increase in X,Y increases by 20.
C)for each unit increase in Y,X increases by 20.
D)none of these.
Question
Question
What is the general form of the regression equation?
A) = ab
= ab
B) = a + bX
C) = a - bX
D) = abX
= abX
A)
= abB)
= a + bXC)
= a - bXD)
= abX Question
Question
In the equation  = a + bX,what is
  ?
?
A)Slope of the line
B)Y intercept
C)Predicted value of Y,given a specific X value
D)Value of Y when X = 0
= a + bX,what is ?A)Slope of the line
B)Y intercept
C)Predicted value of Y,given a specific X value
D)Value of Y when X = 0
Question
A sales manager for an advertising agency believes there is a relationship between the number of contacts and the amount of the sales.To verify this belief,the following data was collected: 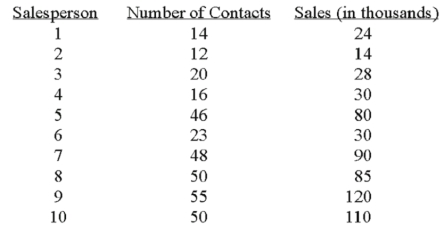 What is the dependent variable?
A)Salesperson
B)Number of contacts
C)Amount of sales
D)All the above
What is the dependent variable?A)Salesperson
B)Number of contacts
C)Amount of sales
D)All the above
Question
Given the least squares regression equation,  = 1202 + 1,133X,when X = 3,what does
  equal?
A)5,734
B)8,000
C)4,601
D)4,050
= 1202 + 1,133X,when X = 3,what does equal?A)5,734
B)8,000
C)4,601
D)4,050
Question
Question
Question
Question
Question
Question

Unlock Deck
Sign up to unlock the cards in this deck!
Unlock Deck
Unlock Deck
1/135
Play
Full screen (f)
Deck 13: Linear Regression and Correlation
1
A coefficient of correlation,r,close to 0 (say,0.08)shows that the relationship between two variables is quite weak.
True
2
The coefficient of determination is the square root of the coefficient of correlation.
False
3
The two variables in a correlation analysis are called the dependent and response variables.
False
4
The coefficient of correlation,r,is often referred to as Spearman's rho.
Unlock Deck
Unlock for access to all 135 flashcards in this deck.
Unlock Deck
k this deck
5
If the coefficient of correlation is -0.90,the coefficient of determination is -0.81.
Unlock Deck
Unlock for access to all 135 flashcards in this deck.
Unlock Deck
k this deck
6
A scatter diagram is a graph that portrays the correlation between a dependent variable and an independent variable.
Unlock Deck
Unlock for access to all 135 flashcards in this deck.
Unlock Deck
k this deck
7
The coefficient of determination is the proportion of total variation in X that is explained by Y.
Unlock Deck
Unlock for access to all 135 flashcards in this deck.
Unlock Deck
k this deck
8
The coefficient of correlation r is often referred to as the Pearson product-moment correlation coefficient.
Unlock Deck
Unlock for access to all 135 flashcards in this deck.
Unlock Deck
k this deck
9
If the coefficient of correlation is -0.50,the coefficient of determination is +0.25.
Unlock Deck
Unlock for access to all 135 flashcards in this deck.
Unlock Deck
k this deck
10
A correlation coefficient equal to -1 or +1 indicates perfect correlation.
Unlock Deck
Unlock for access to all 135 flashcards in this deck.
Unlock Deck
k this deck
11
Correlation coefficients of -0.91 and +0.91 represent relationships between two variables that have equal strength but different directions.
Unlock Deck
Unlock for access to all 135 flashcards in this deck.
Unlock Deck
k this deck
12
A coefficient of correlation of -0.96 indicates a very weak negative correlation.
Unlock Deck
Unlock for access to all 135 flashcards in this deck.
Unlock Deck
k this deck
13
An economist is interested in predicting the unemployment rate based on gross domestic product.Since the economist is interested in predicting unemployment,the independent variable is gross domestic product.
Unlock Deck
Unlock for access to all 135 flashcards in this deck.
Unlock Deck
k this deck
14
The correlation coefficient is the proportion of total variation in Y that is explained by X.
Unlock Deck
Unlock for access to all 135 flashcards in this deck.
Unlock Deck
k this deck
15
Pearson's product-moment correlation coefficient,r,requires that the data be interval or ratio scaled,such as incomes and weights.
Unlock Deck
Unlock for access to all 135 flashcards in this deck.
Unlock Deck
k this deck
16
The strength of the correlation between two variables depends on the sign of the coefficient of correlation.
Unlock Deck
Unlock for access to all 135 flashcards in this deck.
Unlock Deck
k this deck
17
Correlation analysis is a statistical technique used to measure the strength of the relationship between two variables.
Unlock Deck
Unlock for access to all 135 flashcards in this deck.
Unlock Deck
k this deck
18
The standard error of estimate measures the accuracy of a prediction.
Unlock Deck
Unlock for access to all 135 flashcards in this deck.
Unlock Deck
k this deck
19
If the coefficient of correlation is 0.68,the coefficient of determination is 0.4624.
Unlock Deck
Unlock for access to all 135 flashcards in this deck.
Unlock Deck
k this deck
20
The coefficient of determination is the proportion of total variation in Y that is explained by X.
Unlock Deck
Unlock for access to all 135 flashcards in this deck.
Unlock Deck
k this deck
21
The least squares technique minimizes the sum of the squares of the vertical distances between the actual Y values and the predicted values of Y.
Unlock Deck
Unlock for access to all 135 flashcards in this deck.
Unlock Deck
k this deck
22
A regression equation is a mathematical equation that defines the relationship between two variables.
Unlock Deck
Unlock for access to all 135 flashcards in this deck.
Unlock Deck
k this deck
23
Pearson's coefficient of correlation can be used if the data is nominally scaled.
Unlock Deck
Unlock for access to all 135 flashcards in this deck.
Unlock Deck
k this deck
24
The coefficient of determination is equal to or greater than zero.
Unlock Deck
Unlock for access to all 135 flashcards in this deck.
Unlock Deck
k this deck
25
One assumption underlying linear regression is that the Y values are statistically dependent.This means that in selecting a sample,the Y values chosen,for a particular X value,depend on the Y values for any other X value.
Unlock Deck
Unlock for access to all 135 flashcards in this deck.
Unlock Deck
k this deck
26
A t test is used to test the significance of the coefficient of correlation.
Unlock Deck
Unlock for access to all 135 flashcards in this deck.
Unlock Deck
k this deck
27
To test the significance of Pearson's r,we use the standard normal z distribution.
Unlock Deck
Unlock for access to all 135 flashcards in this deck.
Unlock Deck
k this deck
28
When testing the strength of the relationship between two variables,the alternate hypothesis is:
Unlock Deck
Unlock for access to all 135 flashcards in this deck.
Unlock Deck
k this deck
29
In regression analysis,we expect prediction error or ( - Y)does not equal zero.
- Y)does not equal zero. Unlock Deck
Unlock for access to all 135 flashcards in this deck.
Unlock Deck
k this deck
30
The regression equation is used to estimate a value of the dependent variable Y based on a selected value of the independent variable X.
Unlock Deck
Unlock for access to all 135 flashcards in this deck.
Unlock Deck
k this deck
31
In order to visualize the regression equation line,we can draw a scatter diagram.
Unlock Deck
Unlock for access to all 135 flashcards in this deck.
Unlock Deck
k this deck
32
The technique used to measure the strength of the relationship between two variables using the coefficient of correlation and the coefficient of determination is called regression analysis.
Unlock Deck
Unlock for access to all 135 flashcards in this deck.
Unlock Deck
k this deck
33
The standard error of estimate is used to construct confidence intervals when the sample size is large and the scatter about the regression line is somewhat normally distributed.
Unlock Deck
Unlock for access to all 135 flashcards in this deck.
Unlock Deck
k this deck
34
If the coefficient of determination is expressed as a percent,its value is between 0% and 100%.
Unlock Deck
Unlock for access to all 135 flashcards in this deck.
Unlock Deck
k this deck
35
The least squares principle is used to determine the best-fitting line.
Unlock Deck
Unlock for access to all 135 flashcards in this deck.
Unlock Deck
k this deck
36
A confidence interval can be determined for the mean value of Y for a given value of X.
Unlock Deck
Unlock for access to all 135 flashcards in this deck.
Unlock Deck
k this deck
37
Trying to predict weekly sales with a standard error of estimate of $1,955,we would conclude that 68 percent of the predictions would not be off more than $1,955,95 percent would not be off by more $3,910,and 99.7 percent would not be off by more than $5,865.
Unlock Deck
Unlock for access to all 135 flashcards in this deck.
Unlock Deck
k this deck
38
The values of a and b in the regression equation are called the regression coefficients.
Unlock Deck
Unlock for access to all 135 flashcards in this deck.
Unlock Deck
k this deck
39
One assumption underlying linear regression is that for each value of X there is a group of Y values that is normally distributed.
Unlock Deck
Unlock for access to all 135 flashcards in this deck.
Unlock Deck
k this deck
40
When testing the strength of the relationship between two variables,the null hypothesis is:
Unlock Deck
Unlock for access to all 135 flashcards in this deck.
Unlock Deck
k this deck
41
What is the chart called when the paired data (the dependent and independent variables)are plotted?
A)Scatter diagram
B)Bar chart
C)Pie chart
D)Histogram
A)Scatter diagram
B)Bar chart
C)Pie chart
D)Histogram
Unlock Deck
Unlock for access to all 135 flashcards in this deck.
Unlock Deck
k this deck
42
In regression analysis,there is no difference in the width of a confidence interval and the width of a predictor interval.
Unlock Deck
Unlock for access to all 135 flashcards in this deck.
Unlock Deck
k this deck
43
When analyzing a curvilinear relationship between dependent and independent variables,a transformation of the data is necessary.
Unlock Deck
Unlock for access to all 135 flashcards in this deck.
Unlock Deck
k this deck
44
What is the variable used to predict the value of another called?
A)Independent variable
B)Dependent variable
C)Correlation variable
D)Variable of determination
A)Independent variable
B)Dependent variable
C)Correlation variable
D)Variable of determination
Unlock Deck
Unlock for access to all 135 flashcards in this deck.
Unlock Deck
k this deck
45
When analyzing data with regression,a transformation is necessary when the relationship between the dependent and independent variables is linear.
Unlock Deck
Unlock for access to all 135 flashcards in this deck.
Unlock Deck
k this deck
46
A mathematical transformation can be used to change a curvilinear relationship between two variables to a linear relationship.
Unlock Deck
Unlock for access to all 135 flashcards in this deck.
Unlock Deck
k this deck
47
What does a coefficient of correlation of 0.70 infer?
A)Almost no correlation because 0.70 is close to 1.0
B)70% of the variation in one variable is explained by the other
C)Coefficient of determination is 0.49
D)Coefficient of nondetermination is 0.30
A)Almost no correlation because 0.70 is close to 1.0
B)70% of the variation in one variable is explained by the other
C)Coefficient of determination is 0.49
D)Coefficient of nondetermination is 0.30
Unlock Deck
Unlock for access to all 135 flashcards in this deck.
Unlock Deck
k this deck
48
If the correlation coefficient between two variables equals zero,what can be said of the variables X and Y?
A)Not related
B)Dependent on each other
C)Highly related
D)All of these are correct
A)Not related
B)Dependent on each other
C)Highly related
D)All of these are correct
Unlock Deck
Unlock for access to all 135 flashcards in this deck.
Unlock Deck
k this deck
49
Which value of r indicates a stronger correlation than 0.40?
A)-0.30
B)-0.50
C)+0.38
D)0
A)-0.30
B)-0.50
C)+0.38
D)0
Unlock Deck
Unlock for access to all 135 flashcards in this deck.
Unlock Deck
k this deck
50
Which of the following statements regarding the coefficient of correlation is true?
A)It ranges from -1.0 to +1.0 inclusive
B)It measures the strength of the relationship between two variables
C)A value of 0.00 indicates two variables are not related
D)All of these
A)It ranges from -1.0 to +1.0 inclusive
B)It measures the strength of the relationship between two variables
C)A value of 0.00 indicates two variables are not related
D)All of these
Unlock Deck
Unlock for access to all 135 flashcards in this deck.
Unlock Deck
k this deck
51
The smaller the samples,the smaller the standard error of estimate.
Unlock Deck
Unlock for access to all 135 flashcards in this deck.
Unlock Deck
k this deck
52
A confidence interval can be determined for the mean value of X for a given value of Y.
Unlock Deck
Unlock for access to all 135 flashcards in this deck.
Unlock Deck
k this deck
53
Explained variation equals total variation minus unexplained variation.
Unlock Deck
Unlock for access to all 135 flashcards in this deck.
Unlock Deck
k this deck
54
If the correlation between two variables is close to one,the association is
A)strong.
B)moderate.
C)weak.
D)none.
A)strong.
B)moderate.
C)weak.
D)none.
Unlock Deck
Unlock for access to all 135 flashcards in this deck.
Unlock Deck
k this deck
55
What can we conclude if the coefficient of determination is 0.94?
A)Strength of relationship is 0.94.
B)Direction of relationship is positive.
C)94% of total variation of one variable is explained by variation in the other variable.
D)A and B are correct.
A)Strength of relationship is 0.94.
B)Direction of relationship is positive.
C)94% of total variation of one variable is explained by variation in the other variable.
D)A and B are correct.
Unlock Deck
Unlock for access to all 135 flashcards in this deck.
Unlock Deck
k this deck
56
What is the range of values for a coefficient of correlation?
A)0 to +1.0
B)-3 to +3 inclusive
C)-1.0 to +1.0 inclusive
D)Unlimited range
A)0 to +1.0
B)-3 to +3 inclusive
C)-1.0 to +1.0 inclusive
D)Unlimited range
Unlock Deck
Unlock for access to all 135 flashcards in this deck.
Unlock Deck
k this deck
57
If r = 0.65,what does the coefficient of determination equal?
A)0.194
B)0.423
C)0.577
D)0.806
A)0.194
B)0.423
C)0.577
D)0.806
Unlock Deck
Unlock for access to all 135 flashcards in this deck.
Unlock Deck
k this deck
58
A confidence interval is narrower than a prediction interval because a confidence interval estimates a mean Y instead of an individual Y for a given X.
Unlock Deck
Unlock for access to all 135 flashcards in this deck.
Unlock Deck
k this deck
59
What does the coefficient of determination equal if r = 0.89?
A)0.94
B)0.89
C)0.79
D)0.06
A)0.94
B)0.89
C)0.79
D)0.06
Unlock Deck
Unlock for access to all 135 flashcards in this deck.
Unlock Deck
k this deck
60
The least squares method assumes the relationship between the dependent and independent variables is linear.
Unlock Deck
Unlock for access to all 135 flashcards in this deck.
Unlock Deck
k this deck
61
Assume the least squares equation is = 10 + 20X.What does the value of 10 in the equation indicate?
A)Y intercept
B)For each unit increased in Y,X increases by 10
C)For each unit increased in X,Y increases by 10
D)None of these
= 10 + 20X.What does the value of 10 in the equation indicate?A)Y intercept
B)For each unit increased in Y,X increases by 10
C)For each unit increased in X,Y increases by 10
D)None of these
Unlock Deck
Unlock for access to all 135 flashcards in this deck.
Unlock Deck
k this deck
62
Based on the regression equation,we can
A)predict the value of the dependent variable given a value of the independent variable.
B)predict the value of the independent variable given a value of the dependent variable.
C)measure the association between two variables.
D)all of these.
A)predict the value of the dependent variable given a value of the independent variable.
B)predict the value of the independent variable given a value of the dependent variable.
C)measure the association between two variables.
D)all of these.
Unlock Deck
Unlock for access to all 135 flashcards in this deck.
Unlock Deck
k this deck
63
In regression,the difference between the confidence interval and prediction interval formulas is
A)the prediction interval is the square root of the confidence interval.
B)the addition of "1" to the quantity under the radical sign.
C)the prediction interval uses and the confidence interval uses r.
D)no difference.
A)the prediction interval is the square root of the confidence interval.
B)the addition of "1" to the quantity under the radical sign.
C)the prediction interval uses
and the confidence interval uses r.D)no difference.
Unlock Deck
Unlock for access to all 135 flashcards in this deck.
Unlock Deck
k this deck
64
In regression analysis,a transformation is used when.
A)the confidence interval is wider than a prediction interval.
B)two variables are not independent.
C)the relationship between dependent and independent variables is not linear.
D)the correlation is near zero.
A)the confidence interval is wider than a prediction interval.
B)two variables are not independent.
C)the relationship between dependent and independent variables is not linear.
D)the correlation is near zero.
Unlock Deck
Unlock for access to all 135 flashcards in this deck.
Unlock Deck
k this deck
65
Which of the following is true about the standard error of estimate?
A)It is a measure of the accuracy of the prediction
B)It is based on squared vertical deviations between Y and
C)It cannot be negative
D)All of these
A)It is a measure of the accuracy of the prediction
B)It is based on squared vertical deviations between Y and
C)It cannot be negative
D)All of these
Unlock Deck
Unlock for access to all 135 flashcards in this deck.
Unlock Deck
k this deck
66
In the regression equation,what does the letter "a" represent?
A)Y intercept
B)Slope of the line
C)Any value of the independent variable that is selected
D)None of these
A)Y intercept
B)Slope of the line
C)Any value of the independent variable that is selected
D)None of these
Unlock Deck
Unlock for access to all 135 flashcards in this deck.
Unlock Deck
k this deck
67
What is the variable used to predict another variable called?
A)Independent variable
B)Dependent variable
C)Important variable
D)Causal variable
A)Independent variable
B)Dependent variable
C)Important variable
D)Causal variable
Unlock Deck
Unlock for access to all 135 flashcards in this deck.
Unlock Deck
k this deck
68
In the least squares equation, = 10 + 20X the value of 20 indicates
A)the Y intercept.
B)for each unit increase in X,Y increases by 20.
C)for each unit increase in Y,X increases by 20.
D)none of these.
= 10 + 20X the value of 20 indicatesA)the Y intercept.
B)for each unit increase in X,Y increases by 20.
C)for each unit increase in Y,X increases by 20.
D)none of these.
Unlock Deck
Unlock for access to all 135 flashcards in this deck.
Unlock Deck
k this deck
69
If we reject the null hypothesis that tests a population correlation coefficient,what can we conclude about the correlation in the population?
A)It is zero
B)It could be zero
C)It is not zero
D)It equals the computed sample correlation
A)It is zero
B)It could be zero
C)It is not zero
D)It equals the computed sample correlation
Unlock Deck
Unlock for access to all 135 flashcards in this deck.
Unlock Deck
k this deck
70
What is the general form of the regression equation?
A) = ab
B) = a + bX
C) = a - bX
D) = abX
A)
= abB)
= a + bXC)
= a - bXD)
= abX Unlock Deck
Unlock for access to all 135 flashcards in this deck.
Unlock Deck
k this deck
71
In the regression equation,what does the letter "b" represent?
A)Y intercept
B)Slope of the line
C)Any value of the independent variable that is selected
D)Value of Y when X = 0
A)Y intercept
B)Slope of the line
C)Any value of the independent variable that is selected
D)Value of Y when X = 0
Unlock Deck
Unlock for access to all 135 flashcards in this deck.
Unlock Deck
k this deck
72
In the equation = a + bX,what is ?
A)Slope of the line
B)Y intercept
C)Predicted value of Y,given a specific X value
D)Value of Y when X = 0
= a + bX,what is ?A)Slope of the line
B)Y intercept
C)Predicted value of Y,given a specific X value
D)Value of Y when X = 0
Unlock Deck
Unlock for access to all 135 flashcards in this deck.
Unlock Deck
k this deck
73
A sales manager for an advertising agency believes there is a relationship between the number of contacts and the amount of the sales.To verify this belief,the following data was collected: What is the dependent variable?
A)Salesperson
B)Number of contacts
C)Amount of sales
D)All the above
What is the dependent variable?A)Salesperson
B)Number of contacts
C)Amount of sales
D)All the above
Unlock Deck
Unlock for access to all 135 flashcards in this deck.
Unlock Deck
k this deck
74
Given the least squares regression equation, = 1202 + 1,133X,when X = 3,what does equal?
A)5,734
B)8,000
C)4,601
D)4,050
= 1202 + 1,133X,when X = 3,what does equal?A)5,734
B)8,000
C)4,601
D)4,050
Unlock Deck
Unlock for access to all 135 flashcards in this deck.
Unlock Deck
k this deck
75
Which of the following are true assumptions underlying linear regression: 1)for each value of X,there is a group of Y values which is normally distributed;2)the means of these normal distributions of Y values all lie on the straight line of regression;and/or 3)the standard deviations of these normal distributions are equal?
A)Only (1)and (2)
B)Only (1)and (3)
C)Only (2)and (3)
D)All of them
A)Only (1)and (2)
B)Only (1)and (3)
C)Only (2)and (3)
D)All of them
Unlock Deck
Unlock for access to all 135 flashcards in this deck.
Unlock Deck
k this deck
76
If all the plots on a scatter diagram lie on a straight line,what is the standard error of estimate?
A)-1
B)+1
C)0
D)Infinity
A)-1
B)+1
C)0
D)Infinity
Unlock Deck
Unlock for access to all 135 flashcards in this deck.
Unlock Deck
k this deck
77
A hypothesis test is conducted at the .05 level of significance to test whether or not the population correlation is zero.If the sample consists of 25 observations and the correlation coefficient is 0.60,what is the computed value of the test statistic?
A)1.96
B)2.07
C)2.94
D)3.60
A)1.96
B)2.07
C)2.94
D)3.60
Unlock Deck
Unlock for access to all 135 flashcards in this deck.
Unlock Deck
k this deck
78
When comparing the 95% confidence and prediction intervals for a given regression analysis,
A)the confidence interval is wider than a prediction interval.
B)the confidence interval is narrower than a prediction interval.
C)there is no difference between confidence and prediction intervals.
D)none of these.
A)the confidence interval is wider than a prediction interval.
B)the confidence interval is narrower than a prediction interval.
C)there is no difference between confidence and prediction intervals.
D)none of these.
Unlock Deck
Unlock for access to all 135 flashcards in this deck.
Unlock Deck
k this deck
79
What is the range of values for the coefficient of determination?
A)-1 to +1 inclusive
B)-100% to +100% inclusive
C)-100% to 0% inclusive
D)0% to 100% inclusive
A)-1 to +1 inclusive
B)-100% to +100% inclusive
C)-100% to 0% inclusive
D)0% to 100% inclusive
Unlock Deck
Unlock for access to all 135 flashcards in this deck.
Unlock Deck
k this deck
80
Which of the following is NOT a difference between a confidence interval and a prediction interval?
A)Addition of "1" under the radical for the prediction interval.
B)Confidence interval uses the standard error of estimate and the prediction interval does not.
C)Prediction interval refers to a specific case.
D)Confidence interval is narrower than the prediction interval.
A)Addition of "1" under the radical for the prediction interval.
B)Confidence interval uses the standard error of estimate and the prediction interval does not.
C)Prediction interval refers to a specific case.
D)Confidence interval is narrower than the prediction interval.
Unlock Deck
Unlock for access to all 135 flashcards in this deck.
Unlock Deck
k this deck
Unlock Deck
Unlock for access to all 135 flashcards in this deck.


