Deck 3: Descriptive Statistics
Full screen (f)
Question
Question
Question
Question
Question
Question
Question
Question
Question
Question
Question
Question
Question
Question
Question
Question
Question
Question
Question
Question
Question
Question
Question
Question
Question
Question
Question
Question
Question
Question
A graph of class data is below. What is this type of graph called? 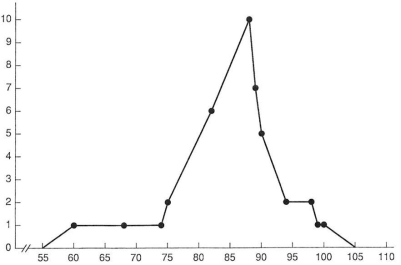
A) Frequency distribution
B) Normal distribution
C) Bell curve
D) Frequency polygon
A) Frequency distribution
B) Normal distribution
C) Bell curve
D) Frequency polygon
Question
What does the vertical line in the normal distribution represent? 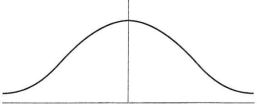
A) Median
B) Mode
C) Mean
D) Central tendency
Using the information below, answer the questions that follow.
Miss Bridget teaches in a small learning support class. The follow are the data from a recent math assessment from three of her students: 84, 80, 74.
A) Median
B) Mode
C) Mean
D) Central tendency
Using the information below, answer the questions that follow.
Miss Bridget teaches in a small learning support class. The follow are the data from a recent math assessment from three of her students: 84, 80, 74.
Question
Question
Question
Question
Question
Question
Question
Question
An individual with an IQ of 130 may be classified as which of the following?
A) Learning disability
B) Gifted
C) Mental retardation
D) Autism
Using the data set below, answer the questions that follow.

A) Learning disability
B) Gifted
C) Mental retardation
D) Autism
Using the data set below, answer the questions that follow.
Question
Question
Question
Question
Question
Question
Question
Question
Question
Question
Question
Question
Question
Question
Question
Question
Question
What type of distribution is depicted below? 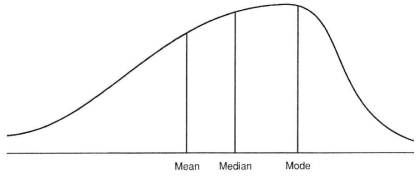
A) Positive skew-Large number of scores occur below the mean.
B) Positive skew-Large number of scores occur above the mean.
C) Negative skew-Large number of scores occur below the mean.
D) Negative skew-Large number of scores occur above the mean.
A) Positive skew-Large number of scores occur below the mean.
B) Positive skew-Large number of scores occur above the mean.
C) Negative skew-Large number of scores occur below the mean.
D) Negative skew-Large number of scores occur above the mean.
Question
Question
Question
Question
What type of distribution is depicted below? 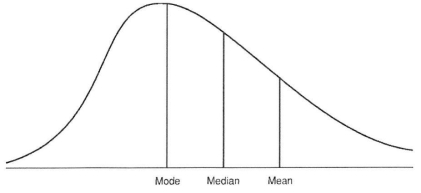
A) Positive skew-Large number of scores occur below the mean.
B) Positive skew-Large number of scores occur above the mean.
C) Negative skew-Large number of scores occur below the mean.
D) Negative skew-Large number of scores occur above the mean.
A) Positive skew-Large number of scores occur below the mean.
B) Positive skew-Large number of scores occur above the mean.
C) Negative skew-Large number of scores occur below the mean.
D) Negative skew-Large number of scores occur above the mean.
Question
Question
Question

Unlock Deck
Sign up to unlock the cards in this deck!
Unlock Deck
Unlock Deck
1/63
Play
Full screen (f)
Deck 3: Descriptive Statistics
1
Derived scores allow professionals to compare how a student performed on a task in comparison with a larger group.
True
2
The mean, median, and mode make up ___.
R. Descriptive Statistics
3
A set of data has a symmetrical distribution of scores with the mean, median, and mode represented by the number 82. This set of data represents a ___.
T. Normal Distribution
4
All fourth-grade students in a Little City School were asked to participate in a reading contest to see which students could read the most books in a three-month period. At the end of the three months, the winners were determined. The ten students who read the most books were awarded prizes. On the final day of the contest, the students anxiously looked at the list where the names were in___, from the highest number of books read to the lowest.
Unlock Deck
Unlock for access to all 63 flashcards in this deck.
Unlock Deck
k this deck
5
The ribbons awarded in a painting contest illustrate which scale?
Unlock Deck
Unlock for access to all 63 flashcards in this deck.
Unlock Deck
k this deck
6
In this set of data, what measures of central tendency are represented by the number 77? 65, 66, 82, 95, 77.
Unlock Deck
Unlock for access to all 63 flashcards in this deck.
Unlock Deck
k this deck
7
Which scale(s) can be added and subtracted but not multiplied?
Unlock Deck
Unlock for access to all 63 flashcards in this deck.
Unlock Deck
k this deck
8
Large sets of data are organized and understood through methods known as Measures of Central Tendency.
Unlock Deck
Unlock for access to all 63 flashcards in this deck.
Unlock Deck
k this deck
9
A multimodal distribution means that there are three or more modes.
Unlock Deck
Unlock for access to all 63 flashcards in this deck.
Unlock Deck
k this deck
10
A seventh-grade pre-algebra class completed the first test of the new school year. Here are the data resulting from the first test: 100, 99, 95, 90, 89, 85, 84, 82, 81, 80, 79, 78, 77, 76, 70, 68, 65, 62, 60, 59, 55. In this set of data, what does the number 45 represent?
Unlock Deck
Unlock for access to all 63 flashcards in this deck.
Unlock Deck
k this deck
11
In a university, all students are given a new student identification number upon registration. These numbers are on what scale?
Unlock Deck
Unlock for access to all 63 flashcards in this deck.
Unlock Deck
k this deck
12
Why is the following set of data interesting? 22, 47, 88, 62, 65, 22, 63, 89, 55, 74, 88, 99, 44, 65, 100.
Unlock Deck
Unlock for access to all 63 flashcards in this deck.
Unlock Deck
k this deck
13
The following set of data has what type of distribution? 88, 33, 78, 56, 44, 37, 90, 99, 76, 78, 77, 62, 90?
Unlock Deck
Unlock for access to all 63 flashcards in this deck.
Unlock Deck
k this deck
14
In a normal distribution, most students' scores fall at the edges of the bell curve.
Unlock Deck
Unlock for access to all 63 flashcards in this deck.
Unlock Deck
k this deck
15
Rank order the following data. Complete a frequency distribution and a frequency polygon. Calculate the mean, median, and mode. Find the range, variance, and standard deviation. Identify scores that are significantly above or below the mean.
Data Set:
85, 85, 99, 63, 60, 97, 96, 95, 58, 70, 72, 92, 89, 87, 74, 74, 74, 85, 84, 78, 84, 78, 84, 78, 86, 82, 79, 81, 80, 86
Data Set:
85, 85, 99, 63, 60, 97, 96, 95, 58, 70, 72, 92, 89, 87, 74, 74, 74, 85, 84, 78, 84, 78, 84, 78, 86, 82, 79, 81, 80, 86
Unlock Deck
Unlock for access to all 63 flashcards in this deck.
Unlock Deck
k this deck
16
What term describes a set of data in which the mean is less than the most frequently occurring scores?
Unlock Deck
Unlock for access to all 63 flashcards in this deck.
Unlock Deck
k this deck
17
If the heights of all fifth-grade elementary students in one large city were measured, in what manner would the resulting data be displayed?
Unlock Deck
Unlock for access to all 63 flashcards in this deck.
Unlock Deck
k this deck
18
Numbers pinned on the shirts of runners in a marathon are numbers used on the ___ scale.
Unlock Deck
Unlock for access to all 63 flashcards in this deck.
Unlock Deck
k this deck
19
The ___ scale has a true meaning of absolute zero.
Unlock Deck
Unlock for access to all 63 flashcards in this deck.
Unlock Deck
k this deck
20
Measuring with a thermometer is an example of using numbers on the ___scale.
Unlock Deck
Unlock for access to all 63 flashcards in this deck.
Unlock Deck
k this deck
21
Variance is described as the degree or amount of dispersion in a data set.
Unlock Deck
Unlock for access to all 63 flashcards in this deck.
Unlock Deck
k this deck
22
Students who participated in the science fair were ranked by category and received first-, second-, and third-place ribbons. This is an example of what type of scale?
A) Ratio
B) Interval
C) Ordinal
D) Nominal
A) Ratio
B) Interval
C) Ordinal
D) Nominal
Unlock Deck
Unlock for access to all 63 flashcards in this deck.
Unlock Deck
k this deck
23
Organizing data to see how the data spread away from the mean is called which of the following?
A) Measures of Dispersion
B) Measures of Central Tendency
C) Frequency
D) Normal Distribution
A) Measures of Dispersion
B) Measures of Central Tendency
C) Frequency
D) Normal Distribution
Unlock Deck
Unlock for access to all 63 flashcards in this deck.
Unlock Deck
k this deck
24
When students enroll in school and are provided with an identification number-a combination of letters and numbers-this number is which scale?
A) Ratio
B) Interval
C) Ordinal
D) Nominal
A) Ratio
B) Interval
C) Ordinal
D) Nominal
Unlock Deck
Unlock for access to all 63 flashcards in this deck.
Unlock Deck
k this deck
25
Median is another name for simple average.
Unlock Deck
Unlock for access to all 63 flashcards in this deck.
Unlock Deck
k this deck
26
This scale's numbers are used for identification that ranks greater or lesser quality or amount. The numbers are equidistant on the scale.
A) Ratio
B) Interval
C) Ordinal
D) Nominal
A) Ratio
B) Interval
C) Ordinal
D) Nominal
Unlock Deck
Unlock for access to all 63 flashcards in this deck.
Unlock Deck
k this deck
27
The square root of the variance is the sum of squares.
Multiple Choice
Multiple Choice
Unlock Deck
Unlock for access to all 63 flashcards in this deck.
Unlock Deck
k this deck
28
What is the standard deviation?
A) 4.11
B) 10
C) 79.33
D) 16.8889
A) 4.11
B) 10
C) 79.33
D) 16.8889
Unlock Deck
Unlock for access to all 63 flashcards in this deck.
Unlock Deck
k this deck
29
Organizing data to see how the data cluster is called which of the following?
A) Measures of Dispersion
B) Measures of Central Tendency
C) Frequency
D) Normal Distribution
A) Measures of Dispersion
B) Measures of Central Tendency
C) Frequency
D) Normal Distribution
Unlock Deck
Unlock for access to all 63 flashcards in this deck.
Unlock Deck
k this deck
30
A graph of class data is below. What is this type of graph called?
A) Frequency distribution
B) Normal distribution
C) Bell curve
D) Frequency polygon
A) Frequency distribution
B) Normal distribution
C) Bell curve
D) Frequency polygon
Unlock Deck
Unlock for access to all 63 flashcards in this deck.
Unlock Deck
k this deck
31
What does the vertical line in the normal distribution represent?
A) Median
B) Mode
C) Mean
D) Central tendency
Using the information below, answer the questions that follow.
Miss Bridget teaches in a small learning support class. The follow are the data from a recent math assessment from three of her students: 84, 80, 74.
A) Median
B) Mode
C) Mean
D) Central tendency
Using the information below, answer the questions that follow.
Miss Bridget teaches in a small learning support class. The follow are the data from a recent math assessment from three of her students: 84, 80, 74.
Unlock Deck
Unlock for access to all 63 flashcards in this deck.
Unlock Deck
k this deck
32
In order for a score to be considered significant it must be at least two standard deviations from the mean.
Unlock Deck
Unlock for access to all 63 flashcards in this deck.
Unlock Deck
k this deck
33
This scale is used for direct comparisons and mathematical manipulations. The numbers on the scale are equidistant from each other and have a true meaning of absolute zero.
A) Ratio
B) Interval
C) Ordinal
D) Nominal
A) Ratio
B) Interval
C) Ordinal
D) Nominal
Unlock Deck
Unlock for access to all 63 flashcards in this deck.
Unlock Deck
k this deck
34
It is possible for the mean score of a data set to become influenced by an extreme score in the data.
Unlock Deck
Unlock for access to all 63 flashcards in this deck.
Unlock Deck
k this deck
35
An individual with an IQ of 70 may be classified as which of the following?
A) Learning disability
B) Gifted
C) Mental intellectual disability
D) Autism
A) Learning disability
B) Gifted
C) Mental intellectual disability
D) Autism
Unlock Deck
Unlock for access to all 63 flashcards in this deck.
Unlock Deck
k this deck
36
Which of the following indicates a raw score?
A) Total test items = 25
B) Correct answers = 20
C) Incorrect answers = 5
D) Ratio = 20/25
A) Total test items = 25
B) Correct answers = 20
C) Incorrect answers = 5
D) Ratio = 20/25
Unlock Deck
Unlock for access to all 63 flashcards in this deck.
Unlock Deck
k this deck
37
The number of times a score occurs in a distribution can be determined by completing a frequency count.
Unlock Deck
Unlock for access to all 63 flashcards in this deck.
Unlock Deck
k this deck
38
This term is used when a national sample of students of the same age/grade take the same assessment and establish a mean and standard deviation.
A) Norm-referenced
B) Standardized
C) Derived scores
D) Measures of central tendency
A) Norm-referenced
B) Standardized
C) Derived scores
D) Measures of central tendency
Unlock Deck
Unlock for access to all 63 flashcards in this deck.
Unlock Deck
k this deck
39
An individual with an IQ of 130 may be classified as which of the following?
A) Learning disability
B) Gifted
C) Mental retardation
D) Autism
Using the data set below, answer the questions that follow.
A) Learning disability
B) Gifted
C) Mental retardation
D) Autism
Using the data set below, answer the questions that follow.
Unlock Deck
Unlock for access to all 63 flashcards in this deck.
Unlock Deck
k this deck
40
What is the variance?
A) 4.11
B) 10
C) 79.33
D) 16.8889
A) 4.11
B) 10
C) 79.33
D) 16.8889
Unlock Deck
Unlock for access to all 63 flashcards in this deck.
Unlock Deck
k this deck
41
A person who scores at the 85%tile scored as well or better than which of the following groups?
A) 14% of the students in that age/grade
B) 84% of the students in that age/grade
C) 85% of the students in that age/grade
D) 15% of the students in that age/grade
A) 14% of the students in that age/grade
B) 84% of the students in that age/grade
C) 85% of the students in that age/grade
D) 15% of the students in that age/grade
Unlock Deck
Unlock for access to all 63 flashcards in this deck.
Unlock Deck
k this deck
42
Describe what a normal distribution is and why is it important in understanding student performance?
Unlock Deck
Unlock for access to all 63 flashcards in this deck.
Unlock Deck
k this deck
43
What is the median?
A) 69
B) 76
C) 26
D) 67
A) 69
B) 76
C) 26
D) 67
Unlock Deck
Unlock for access to all 63 flashcards in this deck.
Unlock Deck
k this deck
44
Define and provide an example of the four different numerical scales.
Unlock Deck
Unlock for access to all 63 flashcards in this deck.
Unlock Deck
k this deck
45
What is the percentile rank that is equivalent to the mean?
A) 20
B) 50
C) 80
D) 90
Short Answer
A) 20
B) 50
C) 80
D) 90
Short Answer
Unlock Deck
Unlock for access to all 63 flashcards in this deck.
Unlock Deck
k this deck
46
Discuss at least five different mistakes that are easily made by professionals in the process of identifying students with special needs.
Unlock Deck
Unlock for access to all 63 flashcards in this deck.
Unlock Deck
k this deck
47
What type of score is derived when scores are divided into 10 groups, and each group represents 10% of the obtained scores?
A) Decile
B) T-score
C) Stanine
D) z score
A) Decile
B) T-score
C) Stanine
D) z score
Unlock Deck
Unlock for access to all 63 flashcards in this deck.
Unlock Deck
k this deck
48
What is the range?
A) 50
B) 76
C) 26
D) 63
A) 50
B) 76
C) 26
D) 63
Unlock Deck
Unlock for access to all 63 flashcards in this deck.
Unlock Deck
k this deck
49
What is a mean difference? Why is it important to know what a mean difference is?.
Unlock Deck
Unlock for access to all 63 flashcards in this deck.
Unlock Deck
k this deck
50
Explain how a mean score can be influenced by extremely high or extremely low scores in a data set.
Unlock Deck
Unlock for access to all 63 flashcards in this deck.
Unlock Deck
k this deck
51
What are some possible considerations when interpreting results which contain distributions that are positively or negatively skewed?
Unlock Deck
Unlock for access to all 63 flashcards in this deck.
Unlock Deck
k this deck
52
Using a standard deviation of 15 IQ points, a person with an obtained IQ score of 115 would have a z score of:
A) +1
B) +2
C) 0
D) −1
A) +1
B) +2
C) 0
D) −1
Unlock Deck
Unlock for access to all 63 flashcards in this deck.
Unlock Deck
k this deck
53
When the mean score is represented as ± 2, what type of score is this?
A) Decile
B) T-score
C) Stanine
D) z score
A) Decile
B) T-score
C) Stanine
D) z score
Unlock Deck
Unlock for access to all 63 flashcards in this deck.
Unlock Deck
k this deck
54
What is the approximate mean?
A) 69
B) 63
C) 26
D) 67
A) 69
B) 63
C) 26
D) 67
Unlock Deck
Unlock for access to all 63 flashcards in this deck.
Unlock Deck
k this deck
55
Why is it necessary to understand the average performance of students in a particular grade or age level?
Unlock Deck
Unlock for access to all 63 flashcards in this deck.
Unlock Deck
k this deck
56
What type of distribution is depicted below?
A) Positive skew-Large number of scores occur below the mean.
B) Positive skew-Large number of scores occur above the mean.
C) Negative skew-Large number of scores occur below the mean.
D) Negative skew-Large number of scores occur above the mean.
A) Positive skew-Large number of scores occur below the mean.
B) Positive skew-Large number of scores occur above the mean.
C) Negative skew-Large number of scores occur below the mean.
D) Negative skew-Large number of scores occur above the mean.
Unlock Deck
Unlock for access to all 63 flashcards in this deck.
Unlock Deck
k this deck
57
What are the four steps required to calculating variance.
Unlock Deck
Unlock for access to all 63 flashcards in this deck.
Unlock Deck
k this deck
58
How are the measures of central tendency different than the measures of dispersion?
Unlock Deck
Unlock for access to all 63 flashcards in this deck.
Unlock Deck
k this deck
59
What is the mode?
A) 26
B) 76
C) 68
D) 69
A) 26
B) 76
C) 68
D) 69
Unlock Deck
Unlock for access to all 63 flashcards in this deck.
Unlock Deck
k this deck
60
What type of distribution is depicted below?
A) Positive skew-Large number of scores occur below the mean.
B) Positive skew-Large number of scores occur above the mean.
C) Negative skew-Large number of scores occur below the mean.
D) Negative skew-Large number of scores occur above the mean.
A) Positive skew-Large number of scores occur below the mean.
B) Positive skew-Large number of scores occur above the mean.
C) Negative skew-Large number of scores occur below the mean.
D) Negative skew-Large number of scores occur above the mean.
Unlock Deck
Unlock for access to all 63 flashcards in this deck.
Unlock Deck
k this deck
61
Draw pictures of a negatively skewed distribution and a positively skewed distribution. Explain each.
Unlock Deck
Unlock for access to all 63 flashcards in this deck.
Unlock Deck
k this deck
62
There is great debate in the field regarding the types of scores yielded from assessments. Which scores do you think will be most valuable to you? Why?
Unlock Deck
Unlock for access to all 63 flashcards in this deck.
Unlock Deck
k this deck
63
In your own words, please describe why it is important to graph data.
Chapter 3 Test Bank Answer Key
True and False
Chapter 3 Test Bank Answer Key
True and False
Unlock Deck
Unlock for access to all 63 flashcards in this deck.
Unlock Deck
k this deck
Unlock Deck
Unlock for access to all 63 flashcards in this deck.


