Deck 13: Part A: Fiscal Policy, Deficits, Surpluses, and Debt
Full screen (f)
Question
Question
Question
Question
Question
Question
Question
Question
Question
Question
Question
Question
Explain how the below graph illustrates the built-in stability of the tax structure. 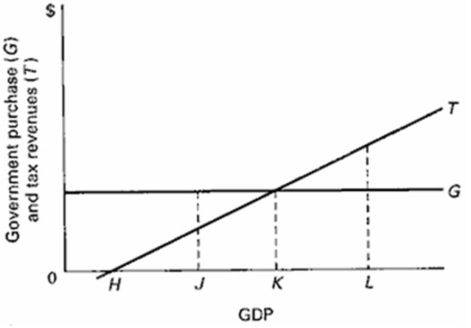
Question
Question
Question
Assume that without any taxes the consumption schedule for an economy is as shown in the table.Also assume that investment, net exports, and government expenditures do not change with changes in real GDP.  (a) What are the MPC, MPS, and the size of the multiplier?
(b) Assume a lump-sum tax of $10 billion is imposed at all levels of GDP.Determine consumption and the tax rate at each level of GDP by completing the following table.Is tax regressive, proportional, or progressive? Compare the multiplier under the lump-sum tax with the pre-tax multiplier. (c) Assume instead that a proportional tax of 10% is imposed at all levels of GDP.Determine consumption at each level of GDP by completing the following table.Compare the multiplier under the proportional tax with the multiplier under the lump-sum tax.Explain why a proportional or progressive tax system contributes to greater economic stability as compared with the lump-sum tax.
(a) What are the MPC, MPS, and the size of the multiplier?(b) Assume a lump-sum tax of $10 billion is imposed at all levels of GDP.Determine consumption and the tax rate at each level of GDP by completing the following table.Is tax regressive, proportional, or progressive? Compare the multiplier under the lump-sum tax with the pre-tax multiplier.
(c) Assume instead that a proportional tax of 10% is imposed at all levels of GDP.Determine consumption at each level of GDP by completing the following table.Compare the multiplier under the proportional tax with the multiplier under the lump-sum tax.Explain why a proportional or progressive tax system contributes to greater economic stability as compared with the lump-sum tax. Question
Question
Question
Question
Question
Question
Question
Question
Question
Question
Question
Question
Question
Question
Complete the table below by stating whether the direction of discretionary fiscal policy was contractionary (C), expansionary (E), or neither (N), given the hypothetical budget data for an economy. 
Question
Question
Question
Question
Question
Using the below graph, illustrate the possible impact of a crowding-out effect of a fiscal policy by drawing in the relevant aggregate demand shifts.Label and explain any shifts in the demand curve shown. 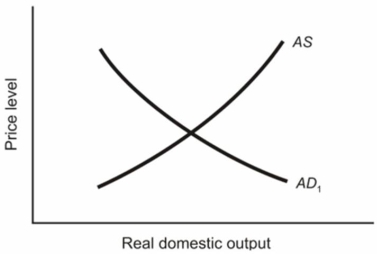
Question
Question
Question
Question
Question
The following table shows government spending and tax revenue for a hypothetical economy over a five-year period.All figures are in billions.  (a) In what years were there budget deficits and what were the amounts?
(b) In what year was there a budget surplus and what was the amount?
(c) What is the public debt in this economy over the five years?
(a) In what years were there budget deficits and what were the amounts?(b) In what year was there a budget surplus and what was the amount?
(c) What is the public debt in this economy over the five years?
Question
Question
Question
The table below gives data on interest rates and investment demand in a hypothetical economy.Figures are in billions.  (a) Use the Id1 schedule.Assume that the government needs to finance a budget deficit and this public borrowing increases the interest rate from 5% to 6%.How much crowding-out of private investment will occur?
(b) Now assume that the deficit is used to improve the performance of the economy, and that as a consequence the investment-demand schedule changes from Id1 to Id2.At the same time, the interest rate rises from 5% to 6% as the government borrows money to finance the deficit.How much crowding-out of private investment will occur in this case?
(c) Graph the two investment-demand schedules on the graph below and show the difference between the two events.Put the interest rate on the vertical axis and the quantity of investment demanded on the horizontal axis.
(a) Use the Id1 schedule.Assume that the government needs to finance a budget deficit and this public borrowing increases the interest rate from 5% to 6%.How much crowding-out of private investment will occur?(b) Now assume that the deficit is used to improve the performance of the economy, and that as a consequence the investment-demand schedule changes from Id1 to Id2.At the same time, the interest rate rises from 5% to 6% as the government borrows money to finance the deficit.How much crowding-out of private investment will occur in this case?
(c) Graph the two investment-demand schedules on the graph below and show the difference between the two events.Put the interest rate on the vertical axis and the quantity of investment demanded on the horizontal axis.
Question
Question
Question
Question
Question
Question
Question
Question
Question
Question
Question

Unlock Deck
Sign up to unlock the cards in this deck!
Unlock Deck
Unlock Deck
1/53
Play
Full screen (f)
Deck 13: Part A: Fiscal Policy, Deficits, Surpluses, and Debt
1
Differentiate between discretionary fiscal policy and non-discretionary policy (or built-in stabilization).
Discretionary fiscal policy is the deliberate manipulation of taxes and government spending by the government to alter real domestic output and employment, to control inflation, and to stimulate economic growth during a particular period of time.Non-discretionary fiscal policy, on the other hand, is the change in transfer payments or taxes which occurs automatically as a result of existing laws.In particular, personal income taxes have progressive rates.As GDP expands, taxes will increase by a greater proportion to slow spending and inflation.As GDP declines, taxes will decrease by a more than proportionate amount allowing incomes and spending to decline at a slower rate than GDP.There are also many transfer programs, which become effective when incomes decline or unemployment occurs to reduce the decline in disposable income.Conversely, these programs automatically are reduced when the economy expands and unemployment declines and spending increases.
2
Give two examples of expansionary fiscal policy.What will be the effect on government surplus/deficit?
Expansionary fiscal policy increases aggregate demand - shifts the aggregate demand curve to the right.In order to do this, governments can increase spending or decrease taxes (or both).Any of these actions will have the tendency to decrease surpluses or increase deficits.
3
In Year 1, the full-employment budget showed a deficit of $100 billion and the actual budget showed a deficit of $150 billion.In Year 2, the full employment budget showed a deficit of $75 billion and the actual budget showed a deficit of $100 billion.Based on the data, what can be concluded about the direction of fiscal policy and the performance of the economy between Years 1 and 2?
The full-employment budget is a better indicator of the direction of fiscal policy than the actual budget.Fiscal policy was contractionary because the full-employment budget deficit decreased from one year to the next.
The actual deficit is composed of the full-employment portion and the cyclical portion.To determine how the economy performed between the two years, the cyclical deficit must be examined.The cyclical portion of the actual deficit is determined by subtracting the full-employment deficit from the actual deficit.The cyclical portion of the actual deficit decreased from $50 to $25 billion.In other words, the economy must have expanded between Years 1 and 2 because net tax revenues increased and the size of the cyclical deficit fell.
The actual deficit is composed of the full-employment portion and the cyclical portion.To determine how the economy performed between the two years, the cyclical deficit must be examined.The cyclical portion of the actual deficit is determined by subtracting the full-employment deficit from the actual deficit.The cyclical portion of the actual deficit decreased from $50 to $25 billion.In other words, the economy must have expanded between Years 1 and 2 because net tax revenues increased and the size of the cyclical deficit fell.
4
During which phases of the business cycle would fiscal policies that reduce budget deficits (or even increase surpluses) be appropriate?
Unlock Deck
Unlock for access to all 53 flashcards in this deck.
Unlock Deck
k this deck
5
In Year 1, the full-employment budget showed a deficit of $100 billion and the actual budget showed a deficit of $150 billion.In Year 2, the full employment budget showed a deficit of $125 billion and the actual budget showed a deficit of $175 billion.Based on the data, what can be concluded about the direction of fiscal policy and the performance of the economy between Years 1 and 2?
Unlock Deck
Unlock for access to all 53 flashcards in this deck.
Unlock Deck
k this deck
6
Under a particular tax system, the government collects $40 billion in tax revenues when GDP is $800 billion and $45 billion when GDP is $900 billion.Is this tax system regressive, proportional, or progressive?
Unlock Deck
Unlock for access to all 53 flashcards in this deck.
Unlock Deck
k this deck
7
Under a particular tax system, the government collects $80 billion in tax revenues when GDP is $800 billion and $88 billion when GDP is $900 billion.Is this tax system regressive, proportional, or progressive?
Unlock Deck
Unlock for access to all 53 flashcards in this deck.
Unlock Deck
k this deck
8
Evaluate: A tax system in which those with higher incomes pay more taxes is progressive.
Unlock Deck
Unlock for access to all 53 flashcards in this deck.
Unlock Deck
k this deck
9
Give a brief definition of fiscal policy? What are its economic goals?
Unlock Deck
Unlock for access to all 53 flashcards in this deck.
Unlock Deck
k this deck
10
Explain what is meant by a built-in stabilizer and give two examples.
Unlock Deck
Unlock for access to all 53 flashcards in this deck.
Unlock Deck
k this deck
11
What does the "full-employment budget" measure and of what significance is this concept? (Note: full-employment budget and cyclically adjusted budget are synonyms.)
Unlock Deck
Unlock for access to all 53 flashcards in this deck.
Unlock Deck
k this deck
12
Explain how the below graph illustrates the built-in stability of the tax structure.
Unlock Deck
Unlock for access to all 53 flashcards in this deck.
Unlock Deck
k this deck
13
In Year 1, the full-employment budget showed a deficit of $100 billion and the actual budget showed a deficit of $150 billion.In Year 2, the full employment budget showed a deficit of $125 billion and the actual budget showed a deficit of $150 billion.Based on the data, what can be concluded about the direction of fiscal policy and the performance of the economy between Years 1 and 2?
Unlock Deck
Unlock for access to all 53 flashcards in this deck.
Unlock Deck
k this deck
14
Explain the aspects of expansionary and contractionary fiscal policy.During which phases of the business cycle would each be appropriate?
Unlock Deck
Unlock for access to all 53 flashcards in this deck.
Unlock Deck
k this deck
15
Assume that without any taxes the consumption schedule for an economy is as shown in the table.Also assume that investment, net exports, and government expenditures do not change with changes in real GDP. (a) What are the MPC, MPS, and the size of the multiplier?
(b) Assume a lump-sum tax of $10 billion is imposed at all levels of GDP.Determine consumption and the tax rate at each level of GDP by completing the following table.Is tax regressive, proportional, or progressive? Compare the multiplier under the lump-sum tax with the pre-tax multiplier. (c) Assume instead that a proportional tax of 10% is imposed at all levels of GDP.Determine consumption at each level of GDP by completing the following table.Compare the multiplier under the proportional tax with the multiplier under the lump-sum tax.Explain why a proportional or progressive tax system contributes to greater economic stability as compared with the lump-sum tax.
(a) What are the MPC, MPS, and the size of the multiplier?(b) Assume a lump-sum tax of $10 billion is imposed at all levels of GDP.Determine consumption and the tax rate at each level of GDP by completing the following table.Is tax regressive, proportional, or progressive? Compare the multiplier under the lump-sum tax with the pre-tax multiplier.
(c) Assume instead that a proportional tax of 10% is imposed at all levels of GDP.Determine consumption at each level of GDP by completing the following table.Compare the multiplier under the proportional tax with the multiplier under the lump-sum tax.Explain why a proportional or progressive tax system contributes to greater economic stability as compared with the lump-sum tax. Unlock Deck
Unlock for access to all 53 flashcards in this deck.
Unlock Deck
k this deck
16
Give two examples of contractionary fiscal policy.What will be the effect on government surplus/deficit?
Unlock Deck
Unlock for access to all 53 flashcards in this deck.
Unlock Deck
k this deck
17
If the government is not implementing a discretionary expansionary fiscal policy, how can its budget move into a deficit?
Unlock Deck
Unlock for access to all 53 flashcards in this deck.
Unlock Deck
k this deck
18
Which fiscal policy, government spending or taxes, is preferable?
Unlock Deck
Unlock for access to all 53 flashcards in this deck.
Unlock Deck
k this deck
19
Describe Canada's Economic Action Plan to combat the Great Recession of 20089 - 2009.
Unlock Deck
Unlock for access to all 53 flashcards in this deck.
Unlock Deck
k this deck
20
"The more progressive a tax system, the greater is the economy's built-in stability." Explain this statement for both recessionary and peak phases of the business cycle.
Unlock Deck
Unlock for access to all 53 flashcards in this deck.
Unlock Deck
k this deck
21
In 2011, the public debt was $617 billion.Put this number in perspective by relating the debt to GDP, to other countries' debt, to the amount of interest payments on the debt, and to ownership of the debt.
Unlock Deck
Unlock for access to all 53 flashcards in this deck.
Unlock Deck
k this deck
22
Comment on the statement: "Discretionary fiscal policy offers an ideal approach to dealing with the nation's economic problems."
Unlock Deck
Unlock for access to all 53 flashcards in this deck.
Unlock Deck
k this deck
23
What fiscal policy is most likely to be invoked during a period of rapid inflation? A period of severe unemployment? What political, investment, and international problems might the government encounter in enacting these policies and putting them into effect?
Unlock Deck
Unlock for access to all 53 flashcards in this deck.
Unlock Deck
k this deck
24
Describe the European Sovereign Debt Crisis.
Unlock Deck
Unlock for access to all 53 flashcards in this deck.
Unlock Deck
k this deck
25
Why do some economists, who favour government intervention to address high unemployment or demand-pull inflation, nonetheless reject the use of fiscal policy?
Unlock Deck
Unlock for access to all 53 flashcards in this deck.
Unlock Deck
k this deck
26
Explain the crowding-out effect.
Unlock Deck
Unlock for access to all 53 flashcards in this deck.
Unlock Deck
k this deck
27
In Year 1, the full-employment budget showed a deficit of $100 billion and the actual budget showed a deficit of $125 billion.In Year 2, the full employment budget showed a deficit of $100 billion and the actual budget showed a deficit of $150 billion.Based on the data, what can be concluded about the direction of fiscal policy and the performance of the economy between Years 1 and 2?
Unlock Deck
Unlock for access to all 53 flashcards in this deck.
Unlock Deck
k this deck
28
Identify and explain the three lags associated with the implementation of fiscal policy.
Unlock Deck
Unlock for access to all 53 flashcards in this deck.
Unlock Deck
k this deck
29
Complete the table below by stating whether the direction of discretionary fiscal policy was contractionary (C), expansionary (E), or neither (N), given the hypothetical budget data for an economy.
Unlock Deck
Unlock for access to all 53 flashcards in this deck.
Unlock Deck
k this deck
30
What information would be important for assessing the size of the public debt beside the absolute amount of the public debt?
Unlock Deck
Unlock for access to all 53 flashcards in this deck.
Unlock Deck
k this deck
31
What is the difference between the actual deficit, the full-employment deficit, and the cyclical deficit?
Unlock Deck
Unlock for access to all 53 flashcards in this deck.
Unlock Deck
k this deck
32
Identify five problems or complications that arise in the implementation of fiscal policy.
Unlock Deck
Unlock for access to all 53 flashcards in this deck.
Unlock Deck
k this deck
33
"If economic forecasting was a more exact science, the business cycle could be entirely corrected by fiscal measures." Do you agree?
Unlock Deck
Unlock for access to all 53 flashcards in this deck.
Unlock Deck
k this deck
34
Using the below graph, illustrate the possible impact of a crowding-out effect of a fiscal policy by drawing in the relevant aggregate demand shifts.Label and explain any shifts in the demand curve shown.
Unlock Deck
Unlock for access to all 53 flashcards in this deck.
Unlock Deck
k this deck
35
Explain how the net-export effect would reduce the effectiveness of fiscal policy.
Unlock Deck
Unlock for access to all 53 flashcards in this deck.
Unlock Deck
k this deck
36
Differentiate between the federal deficit and the federal debt.
Unlock Deck
Unlock for access to all 53 flashcards in this deck.
Unlock Deck
k this deck
37
Given the problems with fiscal policy, why might some economists support its use?
Unlock Deck
Unlock for access to all 53 flashcards in this deck.
Unlock Deck
k this deck
38
State three causes of the public debt.
Unlock Deck
Unlock for access to all 53 flashcards in this deck.
Unlock Deck
k this deck
39
The following table shows government spending and tax revenue for a hypothetical economy over a five-year period.All figures are in billions. (a) In what years were there budget deficits and what were the amounts?
(b) In what year was there a budget surplus and what was the amount?
(c) What is the public debt in this economy over the five years?
(a) In what years were there budget deficits and what were the amounts?(b) In what year was there a budget surplus and what was the amount?
(c) What is the public debt in this economy over the five years?
Unlock Deck
Unlock for access to all 53 flashcards in this deck.
Unlock Deck
k this deck
40
How can the government finance its expenditures?
Unlock Deck
Unlock for access to all 53 flashcards in this deck.
Unlock Deck
k this deck
41
Is the public debt a burden on future generations? Explain.
Unlock Deck
Unlock for access to all 53 flashcards in this deck.
Unlock Deck
k this deck
42
The table below gives data on interest rates and investment demand in a hypothetical economy.Figures are in billions. (a) Use the Id1 schedule.Assume that the government needs to finance a budget deficit and this public borrowing increases the interest rate from 5% to 6%.How much crowding-out of private investment will occur?
(b) Now assume that the deficit is used to improve the performance of the economy, and that as a consequence the investment-demand schedule changes from Id1 to Id2.At the same time, the interest rate rises from 5% to 6% as the government borrows money to finance the deficit.How much crowding-out of private investment will occur in this case?
(c) Graph the two investment-demand schedules on the graph below and show the difference between the two events.Put the interest rate on the vertical axis and the quantity of investment demanded on the horizontal axis.
(a) Use the Id1 schedule.Assume that the government needs to finance a budget deficit and this public borrowing increases the interest rate from 5% to 6%.How much crowding-out of private investment will occur?(b) Now assume that the deficit is used to improve the performance of the economy, and that as a consequence the investment-demand schedule changes from Id1 to Id2.At the same time, the interest rate rises from 5% to 6% as the government borrows money to finance the deficit.How much crowding-out of private investment will occur in this case?
(c) Graph the two investment-demand schedules on the graph below and show the difference between the two events.Put the interest rate on the vertical axis and the quantity of investment demanded on the horizontal axis.
Unlock Deck
Unlock for access to all 53 flashcards in this deck.
Unlock Deck
k this deck
43
How does the public debt contribute to income inequality?
Unlock Deck
Unlock for access to all 53 flashcards in this deck.
Unlock Deck
k this deck
44
If the public debt is a debt that we owe to ourselves, then there are obviously no problems connected with such a debt.Critically evaluate.
Unlock Deck
Unlock for access to all 53 flashcards in this deck.
Unlock Deck
k this deck
45
Is it possible to impose a burden on future generations by increasing the public debt?
Unlock Deck
Unlock for access to all 53 flashcards in this deck.
Unlock Deck
k this deck
46
If we as individuals continue to spend more than we made, we would sooner or later have to pay up or go bankrupt.Our government is in the same position or will be unless we get serious about our liabilities and reduce expenditures enough to reduce the deficits or increase revenues enough to pay our bills and have some left over to pay the old bills.Evaluate this statement.
Unlock Deck
Unlock for access to all 53 flashcards in this deck.
Unlock Deck
k this deck
47
What two factors could reduce the net economic burden that might be shifted to future generations from the public debt?
Unlock Deck
Unlock for access to all 53 flashcards in this deck.
Unlock Deck
k this deck
48
Adam Smith once wrote: "What is prudence in the conduct of every private family can scarce be folly in that of a great kingdom." Evaluate in terms of the national debt.
Unlock Deck
Unlock for access to all 53 flashcards in this deck.
Unlock Deck
k this deck
49
Can a large public debt cause a nation to go bankrupt? Explain.
Unlock Deck
Unlock for access to all 53 flashcards in this deck.
Unlock Deck
k this deck
50
What are four real and potential problems with the public debt?
Unlock Deck
Unlock for access to all 53 flashcards in this deck.
Unlock Deck
k this deck
51
Describe what occurred during the European Sovereign Debt crisis from 2010 till mid-2017.
Unlock Deck
Unlock for access to all 53 flashcards in this deck.
Unlock Deck
k this deck
52
Describe the impact of the European Sovereign Debt Crisis on interest rates for government bonds in Europe
Unlock Deck
Unlock for access to all 53 flashcards in this deck.
Unlock Deck
k this deck
53
How can the effect of an expansionary fiscal policy be weakened?
Unlock Deck
Unlock for access to all 53 flashcards in this deck.
Unlock Deck
k this deck
Unlock Deck
Unlock for access to all 53 flashcards in this deck.


