Deck 9: International Trade Policy, Comparative Advantage, and Outsourcing
Full screen (f)
Question
Question
Question
Question
Question
Question
Question
Question
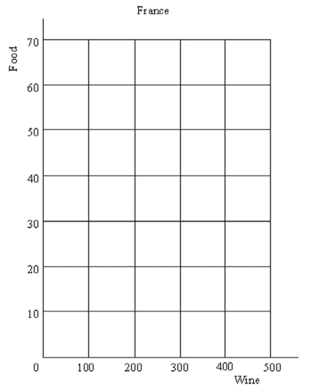
Consider the following information about production of wine and food in England and France: 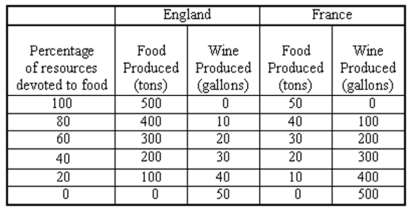 (a) Using the grids below, plot each country's production possibilities curve.
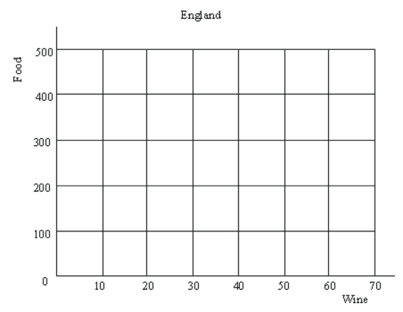
 (b) Which country has a comparative advantage in the production of food? Of wine? Explain.
(c) Suppose that currently England and France are not trading with each other. England is producing (and consuming) 200 tons of food and 30 gallons of wine. France is producing (and consuming) 30 tons of food and 200 gallons of wine. As an international trader, how could you take advantage of this situation and make the big bucks?
(a) Using the grids below, plot each country's production possibilities curve. (b) Which country has a comparative advantage in the production of food? Of wine? Explain.(c) Suppose that currently England and France are not trading with each other. England is producing (and consuming) 200 tons of food and 30 gallons of wine. France is producing (and consuming) 30 tons of food and 200 gallons of wine. As an international trader, how could you take advantage of this situation and make the big bucks?
Question
Question
Question
Question
Question

Unlock Deck
Sign up to unlock the cards in this deck!
Unlock Deck
Unlock Deck
1/13
Play
Full screen (f)
Deck 9: International Trade Policy, Comparative Advantage, and Outsourcing
1
Seamus "Skip" Cavanaugh often travels between Switzerland and Ireland. During his travels he has noticed that the two countries rarely trade with each other. He also noticed that the opportunity cost of producing a watch in Switzerland is 1/5 of a sweater and that the opportunity cost of producing a watch in Ireland is 5 sweaters. At the current time Switzerland's production is 30 sweaters and 200 watches, while Ireland's production is 200 sweaters and 30 watches.
(a) Which country has a comparative advantage in the production of which good? Explain.
(b) Describe how Skip can make a profit.
(c) Illustrate your answer to part (b) with a numerical example.
(a) Which country has a comparative advantage in the production of which good? Explain.
(b) Describe how Skip can make a profit.
(c) Illustrate your answer to part (b) with a numerical example.
(a) Ireland has a comparative advantage in the production of sweaters since it has a lower opportunity cost of producing sweaters than does Switzerland (1/5 watch < 5 watches). Switzerland has a comparative advantage in the production of watches since it has a lower opportunity cost of producing watches than does Ireland (1/5 sweater < 5 sweaters).
(b) Skip can earn a profit by trading watches to Ireland for sweaters and trading sweaters to Switzerland for watches and keeping some of the items for himself.
(c) Many trading arrangements are possible here. An example: Skip says to Switzerland: produce only watches (350 of them) and give me 60 watches in return for 40 sweaters. After this trade Switzerland has 40 sweaters and 290 watches instead of the 30 sweaters and 200 watches it had before the trade. Skip says to Ireland: produce only sweaters (350 of them) and give me 60 sweaters in return for 40 watches. After this trade Ireland has 40 watches and 290 sweaters instead of the 30 watches and 200 sweaters it had before the trade. This leaves 30 watches and 30 sweaters for Skip (his profit).
2
Why does the distribution of costs and benefits from trade sometimes result in calls for trade restrictions?
The gains from trade tend to be widely dispersed and some of the benefits, such as greater efficiency, only accrue in the long run. In contrast the costs of trade (such as domestic jobs lost) tend to be short run and relatively concentrated. This often results in those hurt by trade calling for restrictions.
3
What are sources of U.S. comparative advantage?
The United States has a comparative advantage in a variety of goods and services. Some sources of U.S. comparative advantage include (1) Skills of the U.S. labor force, (2) U.S. governmental institutions, (3) U.S. physical and technological infrastructure, (4) English as the international language of business, (5) Wealth from past production, (6) U.S. natural resources, (7) Cachet, (8) Inertia, (9) U.S. intellectual property rights, and (10) A relatively open immigration policy.
4
Explain why economists' and laypeople's' views of trade differ.
Unlock Deck
Unlock for access to all 13 flashcards in this deck.
Unlock Deck
k this deck
5
Economists have identified three insights that help in determining how the gains from trade will be distributed. Discuss each of those three insights.
Unlock Deck
Unlock for access to all 13 flashcards in this deck.
Unlock Deck
k this deck
6
Explain the principle of comparative advantage. Does it tell us how the gains from trade will be distributed?
Unlock Deck
Unlock for access to all 13 flashcards in this deck.
Unlock Deck
k this deck
7
What is meant by the dollar-euro exchange rate? In what market is this rate determined? What factors will cause the dollar value of the euro to rise? What factors will cause the dollar value of the euro to fall?
Unlock Deck
Unlock for access to all 13 flashcards in this deck.
Unlock Deck
k this deck
8
Consider the following information about production of wine and food in England and France: (a) Using the grids below, plot each country's production possibilities curve. (b) Which country has a comparative advantage in the production of food? Of wine? Explain.
(c) Suppose that currently England and France are not trading with each other. England is producing (and consuming) 200 tons of food and 30 gallons of wine. France is producing (and consuming) 30 tons of food and 200 gallons of wine. As an international trader, how could you take advantage of this situation and make the big bucks?
(a) Using the grids below, plot each country's production possibilities curve. (b) Which country has a comparative advantage in the production of food? Of wine? Explain.(c) Suppose that currently England and France are not trading with each other. England is producing (and consuming) 200 tons of food and 30 gallons of wine. France is producing (and consuming) 30 tons of food and 200 gallons of wine. As an international trader, how could you take advantage of this situation and make the big bucks?
Unlock Deck
Unlock for access to all 13 flashcards in this deck.
Unlock Deck
k this deck
9
What is the resource curse?
Unlock Deck
Unlock for access to all 13 flashcards in this deck.
Unlock Deck
k this deck
10
Is a small or large country likely to gain more by trading? Why?
Unlock Deck
Unlock for access to all 13 flashcards in this deck.
Unlock Deck
k this deck
11
Suppose as a result of a recession and falling interest rates in the United States, European investors buy fewer U.S. financial assets. Conversely, U.S. investors decide to buy more European stocks. Use supply/demand analysis to show graphically why the value of the euro relative to the dollar increases.
Unlock Deck
Unlock for access to all 13 flashcards in this deck.
Unlock Deck
k this deck
12
The United States dominates world markets for computer software, producing about a majority of the total world computer software, whereas Europe and Japan lag significantly behind.
(a) What possible reasons would account for this?
(b) Would you expect this to continue?
(a) What possible reasons would account for this?
(b) Would you expect this to continue?
Unlock Deck
Unlock for access to all 13 flashcards in this deck.
Unlock Deck
k this deck
13
In this problem you will demonstrate your understanding of the principles of comparative advantage. You will be given data that correspond to points on the production possibility curve of two countries. From this data, you will be asked to draw the graph of the production possibility curves. For simplicity, assume the production possibility curves of these countries are straight lines. To draw these production possibility curves you need only two points on your graph. A straight line connecting these points, and extended to the axes, will represent the production possibility curve.
(a) Country A and country B are potential trading partners. Each country produces two goods: fish and wine. If country A devotes all its resources to producing fish it can produce 1,000 fish, and if it devotes all its resources to producing wine, it can produce 2,000 bottles of wine. Draw the production possibility curve for country A. In country A, what is the opportunity cost of one bottle of wine in terms of fish?
(b) If country B devotes all its resources to producing fish it can produce 3,000 fish, and if it devotes all its resources to producing wine it can produce 3,000 bottles of wine. Draw the production possibility curve for country B. In country B, what is the opportunity cost of one bottle of wine in terms of fish?
(c) Do you see any possibility of gains from trade between these two countries? Does country A have any advantage in producing either wine or fish and trading for the other good? Is this advantage an absolute or a comparative advantage?
(d) Suggest a trade between these two countries which will make them both better off. Illustrate on their production possibility curves how this will make both countries better off, by allowing them to consume a mix of wine and fish that is outside their production possibility curves.
Unlock Deck
Unlock for access to all 13 flashcards in this deck.
Unlock Deck
k this deck
Unlock Deck
Unlock for access to all 13 flashcards in this deck.


