Deck 17: Analysis and Interpretation Individual Variables Independently
Full screen (f)
Question
Question
Question
Question
Question
Question
Question
Question
Question
Question
Question
Question
Question
Question
Question
Question
Question
Question
Question
Question
Question
Question
Refer to Scenario 17.4.  The degrees of freedom would equal
A) 14.
B) 24.
C) 219.
D) 199.
E) Cannot tell from the given information.
The degrees of freedom would equalA) 14.
B) 24.
C) 219.
D) 199.
E) Cannot tell from the given information.
Question
Question
Question
Question
Question
Question
Question
Question
Question
Question
Refer to Scenario 17.4: 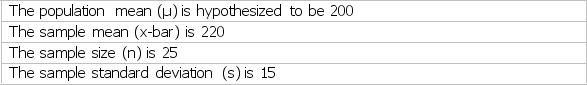 The estimated value of the standard error of the mean is
A) 2.6.
B) 3.0.
C) 1.6.
D) 0.6.
E) 0.9.
The estimated value of the standard error of the mean isA) 2.6.
B) 3.0.
C) 1.6.
D) 0.6.
E) 0.9.
Question
Question
Refer to Scenario 17.4.  The median split for this sample is
A) 100.
B) 110.
C) 200.
D) 220.
E) There is not enough information to determine the median split.
The median split for this sample isA) 100.
B) 110.
C) 200.
D) 220.
E) There is not enough information to determine the median split.
Question
Question
Question
Question
Question
Question
Question
Question
Question
Question
Question
Question
Question
Question
Question
Question
Question
Question
Question
Question
Question
Question
Question
Question
Question
Question
Question
Question
Question
Question
Question
Question
Question
Question
Question

Unlock Deck
Sign up to unlock the cards in this deck!
Unlock Deck
Unlock Deck
1/69
Play
Full screen (f)
Deck 17: Analysis and Interpretation Individual Variables Independently
1
Which of the following would NOT be an example of a situation involving univariate analysis?
A) A publisher of a magazine is interested in determining what proportion of the magazine's readers is male.
B) A restaurant would like to know the average income of its typical diner.
C) A car dealership is particularly interested in whether or not people who own vans are more or less likely to finance auto purchases compared with people who don't own vans.
D) A service provider needs to know her customer's average level of satisfaction with the services provided.
E) All of the above are examples for which univariate analysis could be performed.
C
2
Refer to Scenario 17.2. The chi-square test was used to check whether Miami sales among income groups were consistent with Chicago's. The appropriate degrees of freedom for the chi-square test would be
A) 4
B) 5
C) 500
D) 499
E) None of the above.
A) 4
B) 5
C) 500
D) 499
E) None of the above.
A
3
A frequency analysis is NOT used to
A) locate blunders.
B) locate outliers.
C) determine the empirical distribution of the variable.
D) communicate the results of the study.
E) determine the relationship between two variables.
A) locate blunders.
B) locate outliers.
C) determine the empirical distribution of the variable.
D) communicate the results of the study.
E) determine the relationship between two variables.
E
4
A frequency analysis reveals that the percentage of men owning Dalmatians is 9.93472. Which of the following is the best way to display this finding?
A) 9.93472%
B) 9.93%
C) 10%
D) 9%
E) 9.9%
A) 9.93472%
B) 9.93%
C) 10%
D) 9%
E) 9.9%
Unlock Deck
Unlock for access to all 69 flashcards in this deck.
Unlock Deck
k this deck
5
Which statement(s) pertaining to the chisquare χ2 distribution is FALSE?
A) The chi-square distribution is completely determined by its degrees of freedom.
B) The variable of interest is broken into k mutually exclusive categories.
C) The expected number falling into a category is generated from the null hypothesis.
D) Chi-square degrees of freedom is given by k - 2.
E) The chi-square is appropriate for independent trials.
Unlock Deck
Unlock for access to all 69 flashcards in this deck.
Unlock Deck
k this deck
6
Refer to Scenario 17.1. What is the sample standard deviation?
A) 0.4318
B) 0.3246
C) 0.6571
D) 1.0239
E) Can't be determined from the table.
A) 0.4318
B) 0.3246
C) 0.6571
D) 1.0239
E) Can't be determined from the table.
Unlock Deck
Unlock for access to all 69 flashcards in this deck.
Unlock Deck
k this deck
7
Refer to Scenario 17.3. What would be the expected number of running suits made of fabric B sold during the first three months based on past years' sales results of sweatshirts?
A) 3,500
B) 1,190
C) 4,410
D) 4,500
E) None of the above
A) 3,500
B) 1,190
C) 4,410
D) 4,500
E) None of the above
Unlock Deck
Unlock for access to all 69 flashcards in this deck.
Unlock Deck
k this deck
8
An observation that is very different in magnitude from the rest of the observations for a particular variable is a(n)
A) error.
B) blunder.
C) histogram.
D) outlier.
E) deviant.
A) error.
B) blunder.
C) histogram.
D) outlier.
E) deviant.
Unlock Deck
Unlock for access to all 69 flashcards in this deck.
Unlock Deck
k this deck
9
A bar chart where the values of a variable are placed along the X-axis and the absolute or relative frequency along the Y-axis is called a______________and can be developed from the______________.
A) bar graph, cumulative data
B) frequency polygon, one-way frequency tabulation
C) cumulative distribution graph, cumulative data
D) histogram, uncoded data
E) histogram, one-way frequency tabulation
A) bar graph, cumulative data
B) frequency polygon, one-way frequency tabulation
C) cumulative distribution graph, cumulative data
D) histogram, uncoded data
E) histogram, one-way frequency tabulation
Unlock Deck
Unlock for access to all 69 flashcards in this deck.
Unlock Deck
k this deck
10
Categorical measures are most commonly used to
A) calculate confidence intervals.
B) group respondents or objects into groups.
C) determine the standard deviation.
D) develop histograms.
E) All of the above.
A) calculate confidence intervals.
B) group respondents or objects into groups.
C) determine the standard deviation.
D) develop histograms.
E) All of the above.
Unlock Deck
Unlock for access to all 69 flashcards in this deck.
Unlock Deck
k this deck
11
A researcher calculates a chisquare test statistic of 8.56. At α = .05 and ν = 3, the critical value of the chisquare statistic is 7.81. What is the appropriate statistical conclusion?
A) Reject the null hypothesis.
B) Can't determine; not enough information given.
C) Fail to reject the null hypothesis.
D) Reject the alternative hypothesis.
E) Conclude that the null hypothesis is true.
A) Reject the null hypothesis.
B) Can't determine; not enough information given.
C) Fail to reject the null hypothesis.
D) Reject the alternative hypothesis.
E) Conclude that the null hypothesis is true.
Unlock Deck
Unlock for access to all 69 flashcards in this deck.
Unlock Deck
k this deck
12
Which types of measurement are used to group respondents or objects into groups or categories and are thus referred to as categorical measures?
A) Nominal and interval
B) Ordinal and ratio
C) Ratio and interval
D) Nominal and ordinal
E) Ordinal and interval
A) Nominal and interval
B) Ordinal and ratio
C) Ratio and interval
D) Nominal and ordinal
E) Ordinal and interval
Unlock Deck
Unlock for access to all 69 flashcards in this deck.
Unlock Deck
k this deck
13
Histograms are used to
A) investigate the relation between two variables.
B) construct cumulative distribution functions.
C) construct cross tabulation tables.
D) determine the distribution of nonresponse errors.
E) determine the empirical distribution of a variable.
A) investigate the relation between two variables.
B) construct cumulative distribution functions.
C) construct cross tabulation tables.
D) determine the distribution of nonresponse errors.
E) determine the empirical distribution of a variable.
Unlock Deck
Unlock for access to all 69 flashcards in this deck.
Unlock Deck
k this deck
14
Refer to Scenario 17.2. Using the data provided, the calculated value of χ2 =
A) 0.883
B) 36.30
C) 11.95
D) -0.542
E) Not enough information is provided to calculate the value.
A) 0.883
B) 36.30
C) 11.95
D) -0.542
E) Not enough information is provided to calculate the value.
Unlock Deck
Unlock for access to all 69 flashcards in this deck.
Unlock Deck
k this deck
15
Refer to Scenario 17.1. What is the modal number of televisions owned by the households in the sample?
A) 2
B) More than 3
C) 1
D) 3
E) Can't be determined from the table.
A) 2
B) More than 3
C) 1
D) 3
E) Can't be determined from the table.
Unlock Deck
Unlock for access to all 69 flashcards in this deck.
Unlock Deck
k this deck
16
The chi-square test is an approximate test. The approximation is relatively good if the
A) Expected number of cases in each category is 10 or more.
B) Expected number of cases in each category is 5 or more.
C) Expected number of cases in each category is 3 or more.
D) Actual number of cases in each category is 10 or more.
E) Actual number of cases in each category is 5 or more.
A) Expected number of cases in each category is 10 or more.
B) Expected number of cases in each category is 5 or more.
C) Expected number of cases in each category is 3 or more.
D) Actual number of cases in each category is 10 or more.
E) Actual number of cases in each category is 5 or more.
Unlock Deck
Unlock for access to all 69 flashcards in this deck.
Unlock Deck
k this deck
17
For which of the following is frequency analysis NOT useful?
A) Understanding the relationship between two variables
B) Communicating the results of a study
C) Determining the degree of item nonresponse
D) Locating blunders
E) Locating outliers
A) Understanding the relationship between two variables
B) Communicating the results of a study
C) Determining the degree of item nonresponse
D) Locating blunders
E) Locating outliers
Unlock Deck
Unlock for access to all 69 flashcards in this deck.
Unlock Deck
k this deck
18
A researcher is interested in analyzing a set of nominal data to determine if the observed pattern of frequencies corresponds to the expected pattern. The appropriate statistical technique is
A) chi-square goodness-of-fit.
B) regression analysis.
C) z-test for comparing sample proportion against a standard.
D) z-test for comparing sample mean against a standard.
E) frequency analysis.
A) chi-square goodness-of-fit.
B) regression analysis.
C) z-test for comparing sample proportion against a standard.
D) z-test for comparing sample mean against a standard.
E) frequency analysis.
Unlock Deck
Unlock for access to all 69 flashcards in this deck.
Unlock Deck
k this deck
19
Some of the commonly used measures of location such as the median or quartiles can be read directly from a
A) matrix.
B) frequency polygon.
C) histogram.
D) cumulative distribution function.
E) contingency table.
A) matrix.
B) frequency polygon.
C) histogram.
D) cumulative distribution function.
E) contingency table.
Unlock Deck
Unlock for access to all 69 flashcards in this deck.
Unlock Deck
k this deck
20
Refer to Scenario 17.1. What is the average number of televisions per household?
A) 2.00
B) 1.85
C) 1.52
D) 2.25
E) 2.74
A) 2.00
B) 1.85
C) 1.52
D) 2.25
E) 2.74
Unlock Deck
Unlock for access to all 69 flashcards in this deck.
Unlock Deck
k this deck
21
Which of the following statements concerning the sample standard deviation is FALSE?
A) Sample standard deviation is a measure of the variation in responses.
B) Analysts reporting descriptive statistics for continuous measures should always report standard deviations along with mean values.
C) Standard deviation is meaningful and appropriate only for interval- and nominal-level measures.
D) An analyst must be aware of the concerns of spurious precision when reporting standard deviations.
E) Outliers can have a marked effect the calculation of a standard deviation.
Unlock Deck
Unlock for access to all 69 flashcards in this deck.
Unlock Deck
k this deck
22
Refer to Scenario 17.4. The degrees of freedom would equal
A) 14.
B) 24.
C) 219.
D) 199.
E) Cannot tell from the given information.
The degrees of freedom would equalA) 14.
B) 24.
C) 219.
D) 199.
E) Cannot tell from the given information.
Unlock Deck
Unlock for access to all 69 flashcards in this deck.
Unlock Deck
k this deck
23
Which of the following is FALSE about the use of percentages when reporting results?
A) Unless decimals have a special purpose, they should be omitted.
B) Percentages should be rounded to whole numbers.
C) Decimals may convey greater accuracy than the figures can support.
D) It is unnecessary and redundant to include percentages along with the raw count for frequency analyses.
E) All of the above are true concerning the use of percentages when reporting results.
Unlock Deck
Unlock for access to all 69 flashcards in this deck.
Unlock Deck
k this deck
24
Which of the following would be an appropriate interpretation of a p-value?
A) A p-value of p < 0.0001 is 'highly significant' and therefore much more valid than a p value of 0.05.
B) When a null hypothesis is rejected at some predetermined p level, sampling error is an unlikely explanation of the results, given that the null hypothesis is true.
C) When a p-value shows significance, managerial and practical significance can be assumed.
D) The probability that the research hypothesis is true is equal to 1 minus the p-value.
E) A p-value represents the probability that the results occurred because of sampling error.
Unlock Deck
Unlock for access to all 69 flashcards in this deck.
Unlock Deck
k this deck
25
For which of the following types of measures does the mean NOT provide a meaningful value?
A) Ratio
B) Equal-interval scales
C) Interval
D) Ordinal
E) Continuous measures
A) Ratio
B) Equal-interval scales
C) Interval
D) Ordinal
E) Continuous measures
Unlock Deck
Unlock for access to all 69 flashcards in this deck.
Unlock Deck
k this deck
26
The reporting technique for rating scale questions that presents the percentage of respondents who checked one of the top two positions on a rating scales is known as the
A) ad hoc category combination.
B) response mashup technique.
C) expedient analysis technique.
D) two-box technique.
E) response alignment technique.
A) ad hoc category combination.
B) response mashup technique.
C) expedient analysis technique.
D) two-box technique.
E) response alignment technique.
Unlock Deck
Unlock for access to all 69 flashcards in this deck.
Unlock Deck
k this deck
27
Which of the following statements concerning confidence intervals is FALSE?
A) A confidence interval can be inferred when a probabilistic sample is drawn.
B) A confidence interval is produced by calculating the degree of nonsampling error for the particular statistic.
C) Precision can be increased by increasing sample size or decreasing the confidence level.
D) A narrower confidence interval can be obtained by increasing the sample size.
E) A narrower confidence interval can be obtained by decreasing the degree of confidence desired.
Unlock Deck
Unlock for access to all 69 flashcards in this deck.
Unlock Deck
k this deck
28
Descriptive statistics include all of the following measures EXCEPT
A) median.
B) confidence intervals.
C) skewness.
D) variance.
E) range.
A) median.
B) confidence intervals.
C) skewness.
D) variance.
E) range.
Unlock Deck
Unlock for access to all 69 flashcards in this deck.
Unlock Deck
k this deck
29
Which of the following statements about hypothesis testing is NOT true?
A) Is a means for establishing standards for making decisions about whether to accept sample results as valid for the overall population.
B) Applies to both univariate and multivariate analyses.
C) Lets a researcher know with certainty that a sample result is true for the population.
D) Is generally what marketers begin with when preparing to launch a research study.
E) All of the above are true
Unlock Deck
Unlock for access to all 69 flashcards in this deck.
Unlock Deck
k this deck
30
Which of the following statements if FALSE concerning the conversion of continuous measures to categorical measures?
A) When converting, there is no loss of information about a variable.
B) Because higher levels of measurement have all the properties of measures lower in the hierarchy, conversion is perfectly acceptable.
C) In many cases, conversion is advisable for aiding in interpretation of research study results.
D) Analyses should be performed using the highest level of measurement possible for a particular variable.
E) A simple solution would be to provide both types of results.
Unlock Deck
Unlock for access to all 69 flashcards in this deck.
Unlock Deck
k this deck
31
To calculate sampling error for a proportion, which of the following pieces of information is NOT needed?
A) The z-score representing the desired degree of confidence.
B) The number of valid cases overall for the proportion.
C) The sample standard deviation.
D) The relevant proportion obtained from the sample.
E) All of the above are relevant and necessary pieces of information for the calculation of sampling error for a proportion.
Unlock Deck
Unlock for access to all 69 flashcards in this deck.
Unlock Deck
k this deck
32
Refer to Scenario 17.4: The estimated value of the standard error of the mean is
A) 2.6.
B) 3.0.
C) 1.6.
D) 0.6.
E) 0.9.
The estimated value of the standard error of the mean isA) 2.6.
B) 3.0.
C) 1.6.
D) 0.6.
E) 0.9.
Unlock Deck
Unlock for access to all 69 flashcards in this deck.
Unlock Deck
k this deck
33
Refer to Scenario 17.3. What is the value of the test statistic useful for determining how well the pattern of sales (by fabric type) of the new running suit corresponds to the expected pattern?
A) 136.21
B) 584.81
C) 0.973
D) 422.13
E) None of the above.
A) 136.21
B) 584.81
C) 0.973
D) 422.13
E) None of the above.
Unlock Deck
Unlock for access to all 69 flashcards in this deck.
Unlock Deck
k this deck
34
Refer to Scenario 17.4. The median split for this sample is
A) 100.
B) 110.
C) 200.
D) 220.
E) There is not enough information to determine the median split.
The median split for this sample isA) 100.
B) 110.
C) 200.
D) 220.
E) There is not enough information to determine the median split.
Unlock Deck
Unlock for access to all 69 flashcards in this deck.
Unlock Deck
k this deck
35
Which of the following is TRUE about hypothesis testing?
A) The typical goal is to reject the alternative hypothesis in favor of the null hypothesis.
B) A hypothesis may be rejected but can never be accepted completely.
C) Marketing research studies attempt to prove results.
D) The null hypothesis is assumed to be false for the purpose of the test.
E) All of the above are true about hypothesis testing.
Unlock Deck
Unlock for access to all 69 flashcards in this deck.
Unlock Deck
k this deck
36
The confidence interval is
A) a measure of the variation in responses for continuous measures.
B) the level of error related to the probability of rejecting the null hypothesis.
C) a counting of the number of cases that fall into the various response categories.
D) a projection of the range within which a population parameter will lie at a given level of confidence based on a statistic obtained from an appropriately drawn sample.
E) the arithmetic mean value across all responses for a variable.
Unlock Deck
Unlock for access to all 69 flashcards in this deck.
Unlock Deck
k this deck
37
Refer to Scenario 17.3. What is the appropriate test to determine whether sales results of the new running suit are similar to what would be expected given the previous sales history of sweatshirts made of the three fabrics?
A) Regression analysis
B) z-test for comparing sample mean against a standard
C) Chi-square test
D) z-test for comparing sample proportion against a standard
E) None of the above.
A) Regression analysis
B) z-test for comparing sample mean against a standard
C) Chi-square test
D) z-test for comparing sample proportion against a standard
E) None of the above.
Unlock Deck
Unlock for access to all 69 flashcards in this deck.
Unlock Deck
k this deck
38
Converting from continuous to categorical measures
A) results in loss of information about a variable.
B) works, because higher levels of measurement have all the properties of lower levels of measurement.
C) in many cases is really useful for interpreting the results.
D) is a process that really isn't subject to a lot of rules.
E) All of the above are true.
Unlock Deck
Unlock for access to all 69 flashcards in this deck.
Unlock Deck
k this deck
39
Which of the following statements about mean values is NOT true?
A) Mean values can be calculated for any variable in a data set.
B) Mean values are only meaningful for continuous measures.
C) Mean values should be presented with several decimals, to improve their precision.
D) The mean is only useful with equal-interval scales.
E) Outliers can have a very strong influence on a sample mean.
Unlock Deck
Unlock for access to all 69 flashcards in this deck.
Unlock Deck
k this deck
40
Because______________and______________measures are similar when it comes to analysis, many researchers refer to both types as continuous measures.
A) interval, ratio
B) nominal, interval
C) ordinal, ratio
D) nominal, ordinal
E) ratio, nominal
A) interval, ratio
B) nominal, interval
C) ordinal, ratio
D) nominal, ordinal
E) ratio, nominal
Unlock Deck
Unlock for access to all 69 flashcards in this deck.
Unlock Deck
k this deck
41
An outlier is an observation so different from the rest of the observations that the analyst chooses to treat it as a special case.
Unlock Deck
Unlock for access to all 69 flashcards in this deck.
Unlock Deck
k this deck
42
A researcher determines a sample of size (n) 100 is necessary to estimate a population mean with 95% confidence (z = 2). The calculation of sample size required that he estimate the population standard deviation since it was unknown, and he estimated it as 150. The 100 observations produced a sample mean and a sample standard______________deviation The resulting confidence interval is
A) 970 < μ < 1030.
B) 996 < μ < 1004.
C) 997 < μ < 1003.
D) 960 < μ < 1040.
E) There are two possible confidence intervals.
A) 970 < μ < 1030.
B) 996 < μ < 1004.
C) 997 < μ < 1003.
D) 960 < μ < 1040.
E) There are two possible confidence intervals.
Unlock Deck
Unlock for access to all 69 flashcards in this deck.
Unlock Deck
k this deck
43
The FactFinder Research firm conducted a survey for a national food manufacturer and one of the issues addressed by the research was to determine how many pounds of fish were annually consumed per capita. In the survey they found one person who consumed only one pound of fish per year while 10 people reported 200 pounds per year. The range was
A) 200.
B) 1 to 2,000.
C) 201.
D) 199.
E) None of the above.
A) 200.
B) 1 to 2,000.
C) 201.
D) 199.
E) None of the above.
Unlock Deck
Unlock for access to all 69 flashcards in this deck.
Unlock Deck
k this deck
44
The more confidence we want to have in the interval estimate, the larger the sample size should be.
Unlock Deck
Unlock for access to all 69 flashcards in this deck.
Unlock Deck
k this deck
45
You can "prove" that the alternative hypothesis is true if the null hypothesis is rejected.
Unlock Deck
Unlock for access to all 69 flashcards in this deck.
Unlock Deck
k this deck
46
In using percentages for reporting results it is reasonable to report percentages to two decimal places.
Unlock Deck
Unlock for access to all 69 flashcards in this deck.
Unlock Deck
k this deck
47
In very few cases, it's important to report standard deviations along with mean values.
Unlock Deck
Unlock for access to all 69 flashcards in this deck.
Unlock Deck
k this deck
48
Even if it will help managers interpret results, you should not convert continuous measures to categorical measures.
Unlock Deck
Unlock for access to all 69 flashcards in this deck.
Unlock Deck
k this deck
49
A sample mean is compared against a standard for a large sample. Now, assume the sample mean was found to equal 40. What is the appropriate confidence interval? (Note: Round to the nearest whole number.)
A) 23 < μ < 57
B) Can't be determined from the information given.
C) 14 < μ < 66
D) 38 < μ < 42
E) 20 < μ < 60
A) 23 < μ < 57
B) Can't be determined from the information given.
C) 14 < μ < 66
D) 38 < μ < 42
E) 20 < μ < 60
Unlock Deck
Unlock for access to all 69 flashcards in this deck.
Unlock Deck
k this deck
50
A statistical test to determine whether some observed pattern of frequencies corresponds to an expected pattern is called a chi-square goodness-of-fit test.
Unlock Deck
Unlock for access to all 69 flashcards in this deck.
Unlock Deck
k this deck
51
Because both nominal and ordinal measures are easily used to group respondents or objects into groups or categories, researchers often refer to these types of measures as _.
Unlock Deck
Unlock for access to all 69 flashcards in this deck.
Unlock Deck
k this deck
52
Hypothesis testing involves two mutually exclusive hypotheses that are known as
A) null and alternative.
B) null and conformative.
C) primary and alternate.
D) true and false.
E) normal and variant.
A) null and alternative.
B) null and conformative.
C) primary and alternate.
D) true and false.
E) normal and variant.
Unlock Deck
Unlock for access to all 69 flashcards in this deck.
Unlock Deck
k this deck
53
When a sample mean is compared against a standard for a large sample, which statistic is calculated?
A) t
B) p
C) χ 2
D) s
E) z
A) t
B) p
C) χ 2
D) s
E) z
Unlock Deck
Unlock for access to all 69 flashcards in this deck.
Unlock Deck
k this deck
54
The acceptable level of Type 1 error is usually referred to as the significance level.
Unlock Deck
Unlock for access to all 69 flashcards in this deck.
Unlock Deck
k this deck
55
In the following data set, what is the median? 12, 0, 0, 1, 1, 1, 6, 10, 11.
A) 4.66
B) 1
C) 42
D) 6
E) 0
A) 4.66
B) 1
C) 42
D) 6
E) 0
Unlock Deck
Unlock for access to all 69 flashcards in this deck.
Unlock Deck
k this deck
56
______________ consists of counting the number of cases that fall into the various response categories.
Unlock Deck
Unlock for access to all 69 flashcards in this deck.
Unlock Deck
k this deck
57
A sampling procedure is statistically more efficient than another procedure if, for a given sample size, it results in a larger sampling error.
Unlock Deck
Unlock for access to all 69 flashcards in this deck.
Unlock Deck
k this deck
58
Both nominal and ordinal measures are easily used to group respondents or objects into groups or categories.
Unlock Deck
Unlock for access to all 69 flashcards in this deck.
Unlock Deck
k this deck
59
Which of the following is true regarding the standard deviation?
A) It indicates the degree of variation in the values in such a way as to be translatable into a normal curve.
B) One standard deviation above and below the midpoint in a normal distribution includes approximately 68% of the area underneath the curve.
C) + or - 1.96 standard deviations above and below the midpoint in a normal distribution includes 95% of the area underneath the curve.
D) The standard deviation can be approximated by dividing the range of the data by 6.
E) All of the above are correct.
Unlock Deck
Unlock for access to all 69 flashcards in this deck.
Unlock Deck
k this deck
60
A histogram is a form of bar chart that is based on information from a frequency count.
Unlock Deck
Unlock for access to all 69 flashcards in this deck.
Unlock Deck
k this deck
61
The hypothesis that a proposed result is not true for the population is called the____________________________________________________________________________________________________________________________________________________________________________________________________________________________________________________________ hypothesis.
Unlock Deck
Unlock for access to all 69 flashcards in this deck.
Unlock Deck
k this deck
62
The confidence interval only takes______________error into account.
Unlock Deck
Unlock for access to all 69 flashcards in this deck.
Unlock Deck
k this deck
63
A(n)______________is a bar chart that is based on information from a frequency count.
Unlock Deck
Unlock for access to all 69 flashcards in this deck.
Unlock Deck
k this deck
64
Discuss the most commonly used descriptive statistics.
Unlock Deck
Unlock for access to all 69 flashcards in this deck.
Unlock Deck
k this deck
65
An observation so different in magnitude from the rest of the observations that the analyst chooses to treat it as a special case is______________called a(n) _.
Unlock Deck
Unlock for access to all 69 flashcards in this deck.
Unlock Deck
k this deck
66
A(n)______________interval is a projection of the range within which a population parameter will lie at a given level of confidence based on a statistic obtained from an appropriately drawn sample.
Unlock Deck
Unlock for access to all 69 flashcards in this deck.
Unlock Deck
k this deck
67
The______________is a statistical test to determine whether some observed pattern of frequencies corresponds to and expected pattern.
Unlock Deck
Unlock for access to all 69 flashcards in this deck.
Unlock Deck
k this deck
68
The______________is the most commonly calculated statistic for both interval- and ratio-level measures.
Unlock Deck
Unlock for access to all 69 flashcards in this deck.
Unlock Deck
k this deck
69
The arithmetic mean value across all responses for a variable is called the______________mean.
Unlock Deck
Unlock for access to all 69 flashcards in this deck.
Unlock Deck
k this deck
Unlock Deck
Unlock for access to all 69 flashcards in this deck.


