Deck 8: Hypothesis Testing Using the One-Sample T-Test
Full screen (f)
Question
What happens to the absolute value of  as df increases? It
A)decreases.
B)increases.
C)remains the same.
D)increases or decreases depending on whether is positive or negative.
as df increases? ItA)decreases.
B)increases.
C)remains the same.
D)increases or decreases depending on whether
is positive or negative. Question
Question
Which of the following requirements is common to both the z-test and the one-sample t-test?
A)Alpha is selected to be 0.01.
B)The raw score population forms a normal distribution, and the population mean and standard deviation are known.
C)The standard deviation of the raw score population is estimated by .
.
D)There is one random sample of interval or ratio scores.
A)Alpha is selected to be 0.01.
B)The raw score population forms a normal distribution, and the population mean and standard deviation are known.
C)The standard deviation of the raw score population is estimated by
.D)There is one random sample of interval or ratio scores.
Question
For a two-tailed test with α = 0.05, the  value is
A)either +1.96 or -1.96.
B)both +1.96 and -1.96.
C)either +1.645 or -1.645.
D)different for each df.
value isA)either +1.96 or -1.96.
B)both +1.96 and -1.96.
C)either +1.645 or -1.645.
D)different for each df.
Question
Which of the following is one of the requirements of a one-sample t-test?
A)The obtained scores are either ordinal or interval.
B)The population standard deviation is estimated by computing .
.
C)The population standard deviation is known.
D)The population distribution is skewed.
A)The obtained scores are either ordinal or interval.
B)The population standard deviation is estimated by computing
.C)The population standard deviation is known.
D)The population distribution is skewed.
Question
Question
What does the  value indicate?
A)The probability of rejecting the null hypothesis
B)The probability of retaining the null hypothesis
C)How far the population mean, μ, is from the mean of the sampling distribution of means
D)How far the sample mean is from the μ of the sampling distribution of means
value indicate?A)The probability of rejecting the null hypothesis
B)The probability of retaining the null hypothesis
C)How far the population mean, μ, is from the mean of the sampling distribution of means
D)How far the sample mean is from the μ of the sampling distribution of means
Question
Unless we use the correct from the t-distribution for the appropriate N, 
A)we will fail to reject .
B)we will always reject .
C)the probability of making a Type I error will increase.
D)the probability of making a Type I error will not equal α.
A)we will fail to reject .
B)we will always reject .
C)the probability of making a Type I error will increase.
D)the probability of making a Type I error will not equal α.
Question
Question
Question
Question
Question
For a given level of α, when does  ?
?
A)When the degrees of freedom for the t-test equal the degrees of freedom for the z-test
B)When the degrees of freedom for the t-test equal N for the z-test
C)When the degrees of freedom for the t-test are greater than 120
D)There is never a situation when
?A)When the degrees of freedom for the t-test equal the degrees of freedom for the z-test
B)When the degrees of freedom for the t-test equal N for the z-test
C)When the degrees of freedom for the t-test are greater than 120
D)There is never a situation when
Question
Question
How is the t-distribution defined?
A)The distribution of all possible values of t
B)How far the sample mean is from the μ of the sampling distribution in estimated standard error units
C)The distribution of all possible values of t for random samples having the same N from the population described by
D)The distribution of all possible values of t for random samples having the same N from the population described by
Question
Question
Question
Which of the following is not one of the steps in a one-sample t-test?
A)Create the null hypothesis H0) and alternative hypothesis Ha).
B)Create the sampling t-distribution and find in the t-tables.
C)Compute .
D)Compare to .
.
A)Create the null hypothesis H0) and alternative hypothesis Ha).
B)Create the sampling t-distribution and find
in the t-tables.C)Compute .
D)Compare to
. Question
Colin has computed the variance for his 10 raw scores and obtained = 16.37.He then computed 
 as follows:
 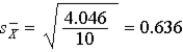 What is wrong?
A)Colin first took the square root of and put this into the formula for
  .He should have used the
  = 16.37 value.
B)Colin should have divided here by N - 1.
C)Colin should not have taken the square root of 4.046/10 because he needs in the formula for the t-test.
D)There is nothing wrong with the way Colin has done this problem.
as follows: What is wrong?A)Colin first took the square root of
and put this into the formula for .He should have used the = 16.37 value.B)Colin should have divided here by N - 1.
C)Colin should not have taken the square root of 4.046/10 because he needs
in the formula for the t-test.D)There is nothing wrong with the way Colin has done this problem.
Question
What is  ?
?
A)The estimated population standard deviation
B)The population standard deviation
C)The estimated standard error of the mean
D)The standard error of the mean
?A)The estimated population standard deviation
B)The population standard deviation
C)The estimated standard error of the mean
D)The standard error of the mean
Question
Question
Using the data given below, perform a two-tailed t-test to compare the sample mean to μ = 35.5.Use α = .05 
Question
Using the following data, conduct a two-tailed t-test.Use a known population mean of 49 and α = .01.
51 48 52 50 48 52 50 48 52 54
50 52 54 47 49 53 47 46 50 51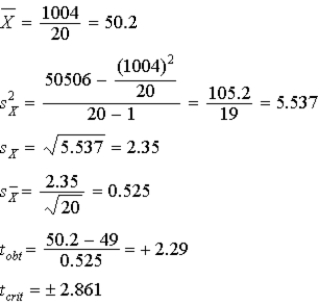
51 48 52 50 48 52 50 48 52 54
50 52 54 47 49 53 47 46 50 51
Question
Using the following data, conduct a one-tailed t-test in the upper tail.Use a known population mean of 49 and α =
.05.
51 48 52 50 48 52 50 48 52 54
50 52 54 47 49 53 47 46 50 51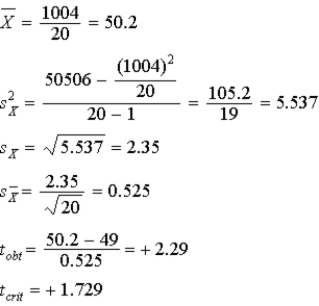
.05.
51 48 52 50 48 52 50 48 52 54
50 52 54 47 49 53 47 46 50 51
Question
Using the following data, conduct a two-tailed t-test.Use a known population mean of 49 and α = .05.
51 48 52 50 48 52 50 48 52 54
50 52 54 47 49 53 47 46 50 51
51 48 52 50 48 52 50 48 52 54
50 52 54 47 49 53 47 46 50 51
Question
Question
Using the following data, compute the t-statistic.Use a known population mean of 28, a two-tailed test, and  = 0.05.
22 19 23 26 18 22 21
31 30 25 20 24 25 23
= 0.05.22 19 23 26 18 22 21
31 30 25 20 24 25 23
Question
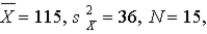
Conduct a two-tailed t-test for 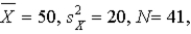 and μ = 48.Use α = .05.Calculate the
  .
.
and μ = 48.Use α = .05.Calculate the . Question
Conduct a two-tailed t-test for 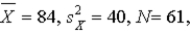 and μ = 87.Use α = .05.What is the value of
  ?
?
and μ = 87.Use α = .05.What is the value of ? Question
Using the following data, compute the t-statistic.Use a known population mean of 20, a one-tailed test in the upper tail, and  = 0.05..
22 19 23 26 18 22 21
31 30 25 20 24 25 23
= 0.05..22 19 23 26 18 22 21
31 30 25 20 24 25 23
Question
For 
 and what is
  ?
?
and what is ? Question
Question
Suppose you conduct an experiment with 20 subjects and the  turns out to be 0.69, which is not statistically significant.What is the correct way to report your results?
turns out to be 0.69, which is not statistically significant.What is the correct way to report your results? Question
Using the following data, conduct a one-tailed t-test in the upper tail.Use a known population mean of 49 and α =
.05.
55 48 59 50 48 52 50 48 57 54
50 52 54 43 44 53 40 46 50 51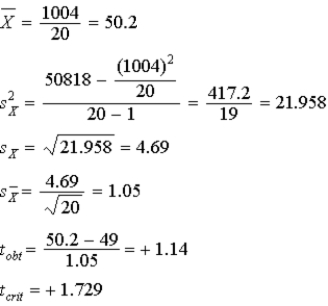
.05.
55 48 59 50 48 52 50 48 57 54
50 52 54 43 44 53 40 46 50 51
Question
Question
Question
Some people claim psychology is common sense.If this is true, then students who have not taken psychology courses should be able to predict the outcomes of experiments as well as psychology majors.If it is not, nonpsychology students should perform worse than psychology students.Psychology students typically predict outcomes with μ = 69% accuracy.A sample of 15 nonpsychology students predicted with 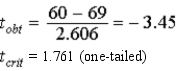
 = 60% accuracy.The
  = 2.606.If appropriate, calculate the 95% confidence interval for nonpsychology students.
= 60% accuracy.The = 2.606.If appropriate, calculate the 95% confidence interval for nonpsychology students. Question
Question
Question
Using the following data, conduct a two-tailed t-test.Use a known population mean of 49 and α = .05.
55 48 59 50 48 52 50 48 57 54
50 52 54 43 44 53 40 46 50 51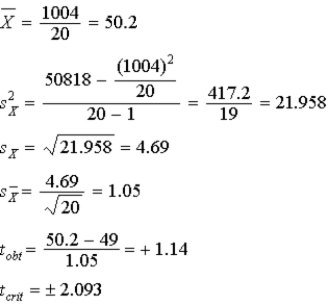
55 48 59 50 48 52 50 48 57 54
50 52 54 43 44 53 40 46 50 51
Question
Question
Question
Question

Unlock Deck
Sign up to unlock the cards in this deck!
Unlock Deck
Unlock Deck
1/44
Play
Full screen (f)
Deck 8: Hypothesis Testing Using the One-Sample T-Test
1
What happens to the absolute value of as df increases? It
A)decreases.
B)increases.
C)remains the same.
D)increases or decreases depending on whether is positive or negative.
as df increases? ItA)decreases.
B)increases.
C)remains the same.
D)increases or decreases depending on whether
is positive or negative.A
2
Suppose we have a 95% confidence interval of 12.23 and 16.75.What does this mean?
A)We are 95% confident that the true population mean is between 12.23 and 16.75.
B)We are 95% confident that the true population mean is either 12.23 or 16.75.
C)The average of 12.23 and 16.75 is probably the true population mean.
D)We are at least 95% certain that neither a Type I nor a Type II error was made.
A
3
Which of the following requirements is common to both the z-test and the one-sample t-test?
A)Alpha is selected to be 0.01.
B)The raw score population forms a normal distribution, and the population mean and standard deviation are known.
C)The standard deviation of the raw score population is estimated by .
D)There is one random sample of interval or ratio scores.
A)Alpha is selected to be 0.01.
B)The raw score population forms a normal distribution, and the population mean and standard deviation are known.
C)The standard deviation of the raw score population is estimated by
.D)There is one random sample of interval or ratio scores.
D
4
For a two-tailed test with α = 0.05, the value is
A)either +1.96 or -1.96.
B)both +1.96 and -1.96.
C)either +1.645 or -1.645.
D)different for each df.
value isA)either +1.96 or -1.96.
B)both +1.96 and -1.96.
C)either +1.645 or -1.645.
D)different for each df.
Unlock Deck
Unlock for access to all 44 flashcards in this deck.
Unlock Deck
k this deck
5
Which of the following is one of the requirements of a one-sample t-test?
A)The obtained scores are either ordinal or interval.
B)The population standard deviation is estimated by computing .
C)The population standard deviation is known.
D)The population distribution is skewed.
A)The obtained scores are either ordinal or interval.
B)The population standard deviation is estimated by computing
.C)The population standard deviation is known.
D)The population distribution is skewed.
Unlock Deck
Unlock for access to all 44 flashcards in this deck.
Unlock Deck
k this deck
6
Which of the following would make it more likely your t-test will be significant?
A)Decreasing the degrees of freedom
B)Using a one-tailed test rather than a two-tailed test
C)Changing α from 0.05 to 0.01
D)Computing a confidence interval for μ
A)Decreasing the degrees of freedom
B)Using a one-tailed test rather than a two-tailed test
C)Changing α from 0.05 to 0.01
D)Computing a confidence interval for μ
Unlock Deck
Unlock for access to all 44 flashcards in this deck.
Unlock Deck
k this deck
7
What does the value indicate?
A)The probability of rejecting the null hypothesis
B)The probability of retaining the null hypothesis
C)How far the population mean, μ, is from the mean of the sampling distribution of means
D)How far the sample mean is from the μ of the sampling distribution of means
value indicate?A)The probability of rejecting the null hypothesis
B)The probability of retaining the null hypothesis
C)How far the population mean, μ, is from the mean of the sampling distribution of means
D)How far the sample mean is from the μ of the sampling distribution of means
Unlock Deck
Unlock for access to all 44 flashcards in this deck.
Unlock Deck
k this deck
8
Unless we use the correct from the t-distribution for the appropriate N,
A)we will fail to reject .
B)we will always reject .
C)the probability of making a Type I error will increase.
D)the probability of making a Type I error will not equal α.
A)we will fail to reject .
B)we will always reject .
C)the probability of making a Type I error will increase.
D)the probability of making a Type I error will not equal α.
Unlock Deck
Unlock for access to all 44 flashcards in this deck.
Unlock Deck
k this deck
9
When is a sample mean likely to represent a particular population mean?
A)It depends on sampling error.
B)It depends on our alpha.
C)When our t-obtained is greater than the expected value of t.
D)When we reject the null hypothesis.
A)It depends on sampling error.
B)It depends on our alpha.
C)When our t-obtained is greater than the expected value of t.
D)When we reject the null hypothesis.
Unlock Deck
Unlock for access to all 44 flashcards in this deck.
Unlock Deck
k this deck
10
Interval estimation suggests a where we expect the to fall.
A)range of values; population parameter
B)specific value; population parameter
C)range of values; sample mean
D)specific value; sample mean
A)range of values; population parameter
B)specific value; population parameter
C)range of values; sample mean
D)specific value; sample mean
Unlock Deck
Unlock for access to all 44 flashcards in this deck.
Unlock Deck
k this deck
11
Suppose a poll has been conducted on Americans' favorable attitudes towards a certain issue.If it is reported that Americans are 56%+4% in favor of the issue, which of the following is not a possible value represented within the margin of error?
A)51%
B)53%
C)56%
D)60%
A)51%
B)53%
C)56%
D)60%
Unlock Deck
Unlock for access to all 44 flashcards in this deck.
Unlock Deck
k this deck
12
When is a t-test used instead of a z-test?
A)When the population μ is known
B)When the population deals with two samples
C)When the population standard deviation is known
D)When the population standard deviation is unknown
A)When the population μ is known
B)When the population deals with two samples
C)When the population standard deviation is known
D)When the population standard deviation is unknown
Unlock Deck
Unlock for access to all 44 flashcards in this deck.
Unlock Deck
k this deck
13
For a given level of α, when does ?
A)When the degrees of freedom for the t-test equal the degrees of freedom for the z-test
B)When the degrees of freedom for the t-test equal N for the z-test
C)When the degrees of freedom for the t-test are greater than 120
D)There is never a situation when
?A)When the degrees of freedom for the t-test equal the degrees of freedom for the z-test
B)When the degrees of freedom for the t-test equal N for the z-test
C)When the degrees of freedom for the t-test are greater than 120
D)There is never a situation when
Unlock Deck
Unlock for access to all 44 flashcards in this deck.
Unlock Deck
k this deck
14
To achieve statistical significance for a one-sample t-test,
A)the t-obtained must be larger than the t-critical.
B)the t-obtained must equal the t-critical.
C)the t-obtained must be less than the t-critical.
D)the t-obtained must differ from the t-critical by .05.
A)the t-obtained must be larger than the t-critical.
B)the t-obtained must equal the t-critical.
C)the t-obtained must be less than the t-critical.
D)the t-obtained must differ from the t-critical by .05.
Unlock Deck
Unlock for access to all 44 flashcards in this deck.
Unlock Deck
k this deck
15
How is the t-distribution defined?
A)The distribution of all possible values of t
B)How far the sample mean is from the μ of the sampling distribution in estimated standard error units
C)The distribution of all possible values of t for random samples having the same N from the population described by
D)The distribution of all possible values of t for random samples having the same N from the population described by
A)The distribution of all possible values of t
B)How far the sample mean is from the μ of the sampling distribution in estimated standard error units
C)The distribution of all possible values of t for random samples having the same N from the population described by
D)The distribution of all possible values of t for random samples having the same N from the population described by
Unlock Deck
Unlock for access to all 44 flashcards in this deck.
Unlock Deck
k this deck
16
The precise location on the dependent measure where we expect our population mean to fall refers to
A)point estimation.
B)interval estimation.
C)margin of error.
D)confidence interval.
A)point estimation.
B)interval estimation.
C)margin of error.
D)confidence interval.
Unlock Deck
Unlock for access to all 44 flashcards in this deck.
Unlock Deck
k this deck
17
After determining your one-tailed t-test is significant, what should you do?
A)See if the test is still significant at a lower α.
B)See if the test is still significant at a higher α.
C)See if the test is still significant if you use a two-tailed test.
D)Compute a confidence interval for μ.
A)See if the test is still significant at a lower α.
B)See if the test is still significant at a higher α.
C)See if the test is still significant if you use a two-tailed test.
D)Compute a confidence interval for μ.
Unlock Deck
Unlock for access to all 44 flashcards in this deck.
Unlock Deck
k this deck
18
Which of the following is not one of the steps in a one-sample t-test?
A)Create the null hypothesis H0) and alternative hypothesis Ha).
B)Create the sampling t-distribution and find in the t-tables.
C)Compute .
D)Compare to .
A)Create the null hypothesis H0) and alternative hypothesis Ha).
B)Create the sampling t-distribution and find
in the t-tables.C)Compute .
D)Compare to
. Unlock Deck
Unlock for access to all 44 flashcards in this deck.
Unlock Deck
k this deck
19
Colin has computed the variance for his 10 raw scores and obtained = 16.37.He then computed as follows: What is wrong?
A)Colin first took the square root of and put this into the formula for .He should have used the = 16.37 value.
B)Colin should have divided here by N - 1.
C)Colin should not have taken the square root of 4.046/10 because he needs in the formula for the t-test.
D)There is nothing wrong with the way Colin has done this problem.
as follows: What is wrong?A)Colin first took the square root of
and put this into the formula for .He should have used the = 16.37 value.B)Colin should have divided here by N - 1.
C)Colin should not have taken the square root of 4.046/10 because he needs
in the formula for the t-test.D)There is nothing wrong with the way Colin has done this problem.
Unlock Deck
Unlock for access to all 44 flashcards in this deck.
Unlock Deck
k this deck
20
What is ?
A)The estimated population standard deviation
B)The population standard deviation
C)The estimated standard error of the mean
D)The standard error of the mean
?A)The estimated population standard deviation
B)The population standard deviation
C)The estimated standard error of the mean
D)The standard error of the mean
Unlock Deck
Unlock for access to all 44 flashcards in this deck.
Unlock Deck
k this deck
21
Using the following data, calculate the standard error of the mean.
55 48 59 50 48 52 50 48 57 54
50 52 54 43 44 53 40 46 50 51
55 48 59 50 48 52 50 48 57 54
50 52 54 43 44 53 40 46 50 51
Unlock Deck
Unlock for access to all 44 flashcards in this deck.
Unlock Deck
k this deck
22
Using the data given below, perform a two-tailed t-test to compare the sample mean to μ = 35.5.Use α = .05
Unlock Deck
Unlock for access to all 44 flashcards in this deck.
Unlock Deck
k this deck
23
Using the following data, conduct a two-tailed t-test.Use a known population mean of 49 and α = .01.
51 48 52 50 48 52 50 48 52 54
50 52 54 47 49 53 47 46 50 51
51 48 52 50 48 52 50 48 52 54
50 52 54 47 49 53 47 46 50 51
Unlock Deck
Unlock for access to all 44 flashcards in this deck.
Unlock Deck
k this deck
24
Using the following data, conduct a one-tailed t-test in the upper tail.Use a known population mean of 49 and α =
.05.
51 48 52 50 48 52 50 48 52 54
50 52 54 47 49 53 47 46 50 51
.05.
51 48 52 50 48 52 50 48 52 54
50 52 54 47 49 53 47 46 50 51
Unlock Deck
Unlock for access to all 44 flashcards in this deck.
Unlock Deck
k this deck
25
Using the following data, conduct a two-tailed t-test.Use a known population mean of 49 and α = .05.
51 48 52 50 48 52 50 48 52 54
50 52 54 47 49 53 47 46 50 51
51 48 52 50 48 52 50 48 52 54
50 52 54 47 49 53 47 46 50 51
Unlock Deck
Unlock for access to all 44 flashcards in this deck.
Unlock Deck
k this deck
26
If a researcher reports a one-sample t-test with df = 24, how many individuals participated in this study?
Unlock Deck
Unlock for access to all 44 flashcards in this deck.
Unlock Deck
k this deck
27
Using the following data, compute the t-statistic.Use a known population mean of 28, a two-tailed test, and = 0.05.
22 19 23 26 18 22 21
31 30 25 20 24 25 23
= 0.05.22 19 23 26 18 22 21
31 30 25 20 24 25 23
Unlock Deck
Unlock for access to all 44 flashcards in this deck.
Unlock Deck
k this deck
28
Conduct a two-tailed t-test for and μ = 48.Use α = .05.Calculate the .
and μ = 48.Use α = .05.Calculate the . Unlock Deck
Unlock for access to all 44 flashcards in this deck.
Unlock Deck
k this deck
29
Conduct a two-tailed t-test for and μ = 87.Use α = .05.What is the value of ?
and μ = 87.Use α = .05.What is the value of ? Unlock Deck
Unlock for access to all 44 flashcards in this deck.
Unlock Deck
k this deck
30
Using the following data, compute the t-statistic.Use a known population mean of 20, a one-tailed test in the upper tail, and = 0.05..
22 19 23 26 18 22 21
31 30 25 20 24 25 23
= 0.05..22 19 23 26 18 22 21
31 30 25 20 24 25 23
Unlock Deck
Unlock for access to all 44 flashcards in this deck.
Unlock Deck
k this deck
31
For and what is ?
and what is ? Unlock Deck
Unlock for access to all 44 flashcards in this deck.
Unlock Deck
k this deck
32
Using the following data, calculate the sample standard deviation.
55 48 59 50 48 52 50 48 57 54
50 52 54 43 44 53 40 46 50 51
55 48 59 50 48 52 50 48 57 54
50 52 54 43 44 53 40 46 50 51
Unlock Deck
Unlock for access to all 44 flashcards in this deck.
Unlock Deck
k this deck
33
Suppose you conduct an experiment with 20 subjects and the turns out to be 0.69, which is not statistically significant.What is the correct way to report your results?
turns out to be 0.69, which is not statistically significant.What is the correct way to report your results? Unlock Deck
Unlock for access to all 44 flashcards in this deck.
Unlock Deck
k this deck
34
Using the following data, conduct a one-tailed t-test in the upper tail.Use a known population mean of 49 and α =
.05.
55 48 59 50 48 52 50 48 57 54
50 52 54 43 44 53 40 46 50 51
.05.
55 48 59 50 48 52 50 48 57 54
50 52 54 43 44 53 40 46 50 51
Unlock Deck
Unlock for access to all 44 flashcards in this deck.
Unlock Deck
k this deck
35
Using the following data, calculate the sample mean.
55 48 59 50 48 52 50 48 57 54
50 52 54 43 44 53 40 46 50 51
55 48 59 50 48 52 50 48 57 54
50 52 54 43 44 53 40 46 50 51
Unlock Deck
Unlock for access to all 44 flashcards in this deck.
Unlock Deck
k this deck
36
Suppose we have a sample mean of 12, estimate standard error of the mean of 2.5, and a t-critical value of 2.306.What would be the lower and upper limits of our confidence interval?
Unlock Deck
Unlock for access to all 44 flashcards in this deck.
Unlock Deck
k this deck
37
Some people claim psychology is common sense.If this is true, then students who have not taken psychology courses should be able to predict the outcomes of experiments as well as psychology majors.If it is not, nonpsychology students should perform worse than psychology students.Psychology students typically predict outcomes with μ = 69% accuracy.A sample of 15 nonpsychology students predicted with = 60% accuracy.The = 2.606.If appropriate, calculate the 95% confidence interval for nonpsychology students.
= 60% accuracy.The = 2.606.If appropriate, calculate the 95% confidence interval for nonpsychology students. Unlock Deck
Unlock for access to all 44 flashcards in this deck.
Unlock Deck
k this deck
38
Suppose you conduct a one-tailed t-test and your results are significant at both the .05 and .01 levels.What should you report and why?
Unlock Deck
Unlock for access to all 44 flashcards in this deck.
Unlock Deck
k this deck
39
What are the two basic consequences of going from a 95% to a 99% confidence interval?
Unlock Deck
Unlock for access to all 44 flashcards in this deck.
Unlock Deck
k this deck
40
Using the following data, conduct a two-tailed t-test.Use a known population mean of 49 and α = .05.
55 48 59 50 48 52 50 48 57 54
50 52 54 43 44 53 40 46 50 51
55 48 59 50 48 52 50 48 57 54
50 52 54 43 44 53 40 46 50 51
Unlock Deck
Unlock for access to all 44 flashcards in this deck.
Unlock Deck
k this deck
41
Identify the major difference between the z- and t-obtained formulas.
Unlock Deck
Unlock for access to all 44 flashcards in this deck.
Unlock Deck
k this deck
42
Suppose you've read about a poll conducted by a certain media outlet surveying the popularity of the U.S.President.This poll puts the President's approval rating at 49.7% +3.5%.Would would be the range that we would expect the actual population values to fall?
Unlock Deck
Unlock for access to all 44 flashcards in this deck.
Unlock Deck
k this deck
43
What is the name of the procedure we can use in the unlikely event that our t-obtained value falls between two t- critical values in the t-table?
Unlock Deck
Unlock for access to all 44 flashcards in this deck.
Unlock Deck
k this deck
44
Suppose you're computing a one-sample t-test and you just finished computing your t-obtained.What is the next step for you to take?
Unlock Deck
Unlock for access to all 44 flashcards in this deck.
Unlock Deck
k this deck
Unlock Deck
Unlock for access to all 44 flashcards in this deck.


