Deck 9: The Single-Sample T Test
Full screen (f)
Question
Question
Question
Question
Question
Question
Question
Question
Question
Question
Question
Question
Question
Question
Question
Question
Question
Question
Question
Question
Question
Question
Question
Question
Question
Question
Question
Question
Question
Question
Question
Question
Question
Question
Question
Question
Question
Question
Question
Question
Question
Question
Question
Question
Use the following to answer questions
This figure represents the distribution of the percent of state residents living in a metropolitan area for all 50 U.S.states and Washington D.C.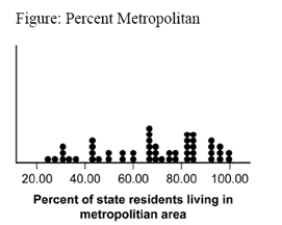
(Figure: Percent Metropolitan) The figure indicates that:
A) most states have greater than 60 percent of their population living in metropolitan areas.
B) on average, 60 percent of all states' populations live in a metropolitan area.
C) the population of most states is concentrated in rural areas.
D) few states have larger urban centers.
Question
Question
Question
Question
Question
Question
Question
Question
Question
Question
Question
Question
Question
Question
Use the following to answer questions
This figure represents the distribution of the percent of state residents living in a metropolitan area for all 50 U.S.states and Washington D.C.
(Figure: Percent Metropolitan) The plot in the figure is a:
A) histogram.
B) stem-and-leaf plot.
C) dot plot.
D) box plot.
This figure represents the distribution of the percent of state residents living in a metropolitan area for all 50 U.S.states and Washington D.C.
(Figure: Percent Metropolitan) The plot in the figure is a:
A) histogram.
B) stem-and-leaf plot.
C) dot plot.
D) box plot.
Question
Question
Question
Question
Question
Question
Question
Question
Question
Question
Question
Question
Question
Question
Question
Question
Question
Question
Question
Question
Question
Question

Unlock Deck
Sign up to unlock the cards in this deck!
Unlock Deck
Unlock Deck
1/124
Play
Full screen (f)
Deck 9: The Single-Sample T Test
1
As the sample size becomes larger, the t distributions look ________ the z distribution.
A) less like
B) more like
C) different from
D) taller than
A) less like
B) more like
C) different from
D) taller than
more like
2
The average salary for all 27 Arizona Diamondbacks in the 2012 baseball season was $2,653,029, with a standard deviation of $2,587,139.The population, all National League baseball players in 2012, earned an average salary of $3,213,479, with a standard deviation of $1,451,308.Does the average salary of the Diamondbacks players differ from that of all players in the National League? What statistical analysis is used to answer this question?
A) single-sample t test
B) z test
C) standard deviation analysis
D) dependent-samples t test
A) single-sample t test
B) z test
C) standard deviation analysis
D) dependent-samples t test
z test
3
A t statistic is _______ as a z statistic, making it _______.
A) not as extreme; less conservative
B) not as extreme; more conservative
C) more extreme; less conservative
D) more extreme; more conservative
A) not as extreme; less conservative
B) not as extreme; more conservative
C) more extreme; less conservative
D) more extreme; more conservative
not as extreme; more conservative
4
If the standard deviation for a population, as estimated from a sample, is s = 6.47, then the standard error for a sample size of N = 20 is sM =:
A) 0.32.
B) 1.45.
C) 2.09.
D) 2.29.
A) 0.32.
B) 1.45.
C) 2.09.
D) 2.29.
Unlock Deck
Unlock for access to all 124 flashcards in this deck.
Unlock Deck
k this deck
5
The difference between the denominator of the z statistic and that of the single-sample t statistic is that in a:
A) z statistic we divide by the actual population standard error (sM), but in a t statistic we divide by the estimated standard error ( M).
B) z statistic we divide by the actual population standard error ( M), but in a t statistic we divide by the estimated standard error (sM).
C) t statistic we divide by the actual population standard error (sM), but in a z statistic we divide by the estimated standard error ( M).
D) t statistic we divide by the actual population standard error ( M), but in a z statistic we divide by the estimated standard error (sM).
Unlock Deck
Unlock for access to all 124 flashcards in this deck.
Unlock Deck
k this deck
6
A researcher collects 25 data points that yield a mean of 8.164 and a standard deviation (based on N - 1) of 2.237.What is the standard error for the distribution of means?
A) 0.089.
B) 0.200
C) 0.447
D) 0.614
A) 0.089.
B) 0.200
C) 0.447
D) 0.614
Unlock Deck
Unlock for access to all 124 flashcards in this deck.
Unlock Deck
k this deck
7
As the sample size becomes larger, the t distributions become:
A) narrower.
B) wider.
C) broader.
D) less accurate.
A) narrower.
B) wider.
C) broader.
D) less accurate.
Unlock Deck
Unlock for access to all 124 flashcards in this deck.
Unlock Deck
k this deck
8
The symbol representing a standard deviation calculated by using a sample to estimate the population standard deviation is:
A) sd.
B)
C) s.
D) SD.
A) sd.
B)
C) s.
D) SD.
Unlock Deck
Unlock for access to all 124 flashcards in this deck.
Unlock Deck
k this deck
9
The symbol s is a _____ letter that describes a _____ statistic.
A) Latin; sample
B) Greek; sample
C) Latin; population
D) Greek; population
A) Latin; sample
B) Greek; sample
C) Latin; population
D) Greek; population
Unlock Deck
Unlock for access to all 124 flashcards in this deck.
Unlock Deck
k this deck
10
As the sample size becomes smaller, the t distributions become:
A) narrower.
B) wider.
C) more reliable.
D) more accurate.
A) narrower.
B) wider.
C) more reliable.
D) more accurate.
Unlock Deck
Unlock for access to all 124 flashcards in this deck.
Unlock Deck
k this deck
11
When the population mean but not the population standard deviation is known, which statistic is used to compare a sample to the population?
A)
B) z
C) F
D) t
A)
B) z
C) F
D) t
Unlock Deck
Unlock for access to all 124 flashcards in this deck.
Unlock Deck
k this deck
12
If the standard deviation for a population, as estimated from a sample, is s = 3.8, then the standard error for a sample size of N = 16 is sM =:
A) 0.24.
B) 0.90.
C) 0.95.
D) 1.40.
A) 0.24.
B) 0.90.
C) 0.95.
D) 1.40.
Unlock Deck
Unlock for access to all 124 flashcards in this deck.
Unlock Deck
k this deck
13
It is known that the population mean on the math portion of the SAT is 500, with a standard deviation of 100.Assume that the average math SAT score for freshmen entering your college is 550, with a standard deviation of 110.Does the math performance of students entering your college differ from that of all individuals taking the SAT? What statistical analysis is used to answer this question?
A) single-sample t test
B) z test
C) standard deviation analysis
D) dependent-samples t test
A) single-sample t test
B) z test
C) standard deviation analysis
D) dependent-samples t test
Unlock Deck
Unlock for access to all 124 flashcards in this deck.
Unlock Deck
k this deck
14
What is the correct formula for using the sample standard deviation to estimate the population standard deviation?
A)
B)
C)
D)
A)
B)
C)
D)
Unlock Deck
Unlock for access to all 124 flashcards in this deck.
Unlock Deck
k this deck
15
Why does one divide by N - 1 rather than by N when estimating a population standard deviation from the sample standard deviation?
A) Because the sample standard deviation is likely to be an imprecise estimate, we allow the error of the estimate (the standard deviation) to be larger by dividing the sum of squares by a smaller number.
B) The sample standard deviation is a superior estimate of the variability in the population than is the population standard deviation.
C) We typically have to throw out at least one data point in any given study, so the N - 1 allows us to account for that.
D) Because the population is always smaller than the sample, we must divide by a smaller number.
Unlock Deck
Unlock for access to all 124 flashcards in this deck.
Unlock Deck
k this deck
16
The following data were collected from a veterinarian's office over the course of a day to assess the average weight of dogs (in pounds): 10, 5, 17, 22, 50, 32, 38, and 29.What is the standard deviation for these data, first without the correction and then with the correction used when estimating a population?
A) 13.00; 13.90
B) 13.90; 13.00
C) 13.95; 14.91
D) 14.91; 13.95
A) 13.00; 13.90
B) 13.90; 13.00
C) 13.95; 14.91
D) 14.91; 13.95
Unlock Deck
Unlock for access to all 124 flashcards in this deck.
Unlock Deck
k this deck
17
What is the correct formula for calculating the standard deviation of a sample when one is NOT trying to estimate the population standard deviation?
A)
B)
C)
D)
A)
B)
C)
D)
Unlock Deck
Unlock for access to all 124 flashcards in this deck.
Unlock Deck
k this deck
18
The standard deviation of a distribution of scores in a sample is known as _____, while the standard deviation of a distribution of means is referred to as _____.
A) sM; s
B) s;
C) s; sM
D) M;
A) sM; s
B) s;
C) s; sM
D) M;
Unlock Deck
Unlock for access to all 124 flashcards in this deck.
Unlock Deck
k this deck
19
A researcher collects 25 data points that yield a mean of 8.164 and a standard deviation (based on N - 1) of 2.237.If the researcher is comparing the sample to a population mean of 9.2, what is the value of the test statistic?
A) 0.447
B) -1.036
C) -2.316
D) -2.339
A) 0.447
B) -1.036
C) -2.316
D) -2.339
Unlock Deck
Unlock for access to all 124 flashcards in this deck.
Unlock Deck
k this deck
20
What is the formula for the single-sample t statistic?
A)
B)
C)
D)
A)
B)
C)
D)
Unlock Deck
Unlock for access to all 124 flashcards in this deck.
Unlock Deck
k this deck
21
The third step in conducting the single-sample t test is:
A) identifying a Type I error.
B) stating the null hypothesis.
C) stating the research hypothesis.
D) determining the characteristics of the comparison distribution.
A) identifying a Type I error.
B) stating the null hypothesis.
C) stating the research hypothesis.
D) determining the characteristics of the comparison distribution.
Unlock Deck
Unlock for access to all 124 flashcards in this deck.
Unlock Deck
k this deck
22
The t statistic indicates the:
A) number of standard deviations an individual score is from the sample mean.
B) number of standard deviations a sample is from the population mean.
C) distance of two sample means from a single population mean.
D) distance of a sample mean from the population mean in terms of estimated standard error.
Unlock Deck
Unlock for access to all 124 flashcards in this deck.
Unlock Deck
k this deck
23
A negatively skewed distribution would most likely violate which assumption?
A) normality
B) dependent variable is scale
C) random selection
D) random assignment
A) normality
B) dependent variable is scale
C) random selection
D) random assignment
Unlock Deck
Unlock for access to all 124 flashcards in this deck.
Unlock Deck
k this deck
24
The first step in conducting the single-sample t test includes:
A) identifying a Type I error.
B) identifying a Type II error.
C) checking that assumptions have been met.
D) stating the null hypothesis.
A) identifying a Type I error.
B) identifying a Type II error.
C) checking that assumptions have been met.
D) stating the null hypothesis.
Unlock Deck
Unlock for access to all 124 flashcards in this deck.
Unlock Deck
k this deck
25
The second step in conducting the single-sample t test involves _____ and _____.
A) identifying a Type I error; checking that assumptions have been met
B) identifying a Type II error; stating the null hypothesis
C) stating the null hypothesis; stating the research hypothesis
D) stating the null hypothesis; identifying effect size
A) identifying a Type I error; checking that assumptions have been met
B) identifying a Type II error; stating the null hypothesis
C) stating the null hypothesis; stating the research hypothesis
D) stating the null hypothesis; identifying effect size
Unlock Deck
Unlock for access to all 124 flashcards in this deck.
Unlock Deck
k this deck
26
With very few degrees of freedom, the test statistic:
A) becomes more reliable.
B) should be a z test rather than a t test.
C) needs to be more extreme to reject the null hypothesis.
D) needs to be less extreme to reject the null hypothesis.
A) becomes more reliable.
B) should be a z test rather than a t test.
C) needs to be more extreme to reject the null hypothesis.
D) needs to be less extreme to reject the null hypothesis.
Unlock Deck
Unlock for access to all 124 flashcards in this deck.
Unlock Deck
k this deck
27
At a sample size of infinity, the t distribution:
A) is unreliable.
B) has a standard deviation of 0.
C) is identical to the z distribution.
D) has a standard deviation of 0.50.
A) is unreliable.
B) has a standard deviation of 0.
C) is identical to the z distribution.
D) has a standard deviation of 0.50.
Unlock Deck
Unlock for access to all 124 flashcards in this deck.
Unlock Deck
k this deck
28
The fifth step in conducting the single-sample t test is:
A) identifying a Type I error.
B) determining the critical values or cutoffs.
C) calculating the test statistic.
D) determining the characteristics of the comparison distribution.
A) identifying a Type I error.
B) determining the critical values or cutoffs.
C) calculating the test statistic.
D) determining the characteristics of the comparison distribution.
Unlock Deck
Unlock for access to all 124 flashcards in this deck.
Unlock Deck
k this deck
29
When scientists call a hypothesis test conservative, they mean that it:
A) is difficult to reject the null hypothesis (i.e., the status quo).
B) leads to results that Republicans will find favorable.
C) is very easy to reject the null hypothesis (i.e., the status quo).
D) leads to results that Democrats will find favorable.
A) is difficult to reject the null hypothesis (i.e., the status quo).
B) leads to results that Republicans will find favorable.
C) is very easy to reject the null hypothesis (i.e., the status quo).
D) leads to results that Democrats will find favorable.
Unlock Deck
Unlock for access to all 124 flashcards in this deck.
Unlock Deck
k this deck
30
Many companies that manufacture lightbulbs advertise their 60-watt bulbs as having an average life of 1000 hours.A cynical consumer bought 30 bulbs and burned them until they failed.He found that they burned for an average of M = 1233, with a standard deviation of s = 232.06.What statistical test would this consumer use to determine whether the average burn time of lightbulbs differs significantly from that advertised?
A) single-sample t test
B) z test
C) standard deviation analysis
D) dependent-samples t test
A) single-sample t test
B) z test
C) standard deviation analysis
D) dependent-samples t test
Unlock Deck
Unlock for access to all 124 flashcards in this deck.
Unlock Deck
k this deck
31
The formula for the degrees of freedom for the single-sample t test is:
A) N.
B) dfX + dfY.
C) N - 1.
D) (N - 1)(N - 1).
A) N.
B) dfX + dfY.
C) N - 1.
D) (N - 1)(N - 1).
Unlock Deck
Unlock for access to all 124 flashcards in this deck.
Unlock Deck
k this deck
32
A newspaper article reported that the typical American family spent an average of $81 for Halloween candy and costumes last year.A sample of N = 16 families this year reported spending a mean of M = $85, with s = $20.What statistical test would be used to determine whether these data indicate a significant change in holiday spending?
A) single-sample t test
B) z test
C) effect size test
D) paired-samples t test
A) single-sample t test
B) z test
C) effect size test
D) paired-samples t test
Unlock Deck
Unlock for access to all 124 flashcards in this deck.
Unlock Deck
k this deck
33
H0: 1 = 2 is used to represent the:
A) confidence interval.
B) research hypothesis.
C) null hypothesis.
D) standard error.
A) confidence interval.
B) research hypothesis.
C) null hypothesis.
D) standard error.
Unlock Deck
Unlock for access to all 124 flashcards in this deck.
Unlock Deck
k this deck
34
Based on the statistical results provided, which would lead us to reject the null hypothesis?
A) t(5) = 3.2, p = 0.06
B) t(5) = 3.2, p = 0.10
C) t(5) = 3.2, p < 0.05
D) t(5) = 3.2, p > 0.05
A) t(5) = 3.2, p = 0.06
B) t(5) = 3.2, p = 0.10
C) t(5) = 3.2, p < 0.05
D) t(5) = 3.2, p > 0.05
Unlock Deck
Unlock for access to all 124 flashcards in this deck.
Unlock Deck
k this deck
35
A single-sample t test is conducted on a sample of 26 people who were selected from a large population estimated at 2500 people.The critical cutoff for a two-tailed test at a p level of 0.05 would be:
A) -1.706 and 1.706.
B) -1.708 and 1.708.
C) -2.056 and 2.056.
D) -2.060 and 2.060.
A) -1.706 and 1.706.
B) -1.708 and 1.708.
C) -2.056 and 2.056.
D) -2.060 and 2.060.
Unlock Deck
Unlock for access to all 124 flashcards in this deck.
Unlock Deck
k this deck
36
The single-sample t test compares a sample mean to a population mean when:
A) the sample standard deviation is unknown.
B) no comparison can be made based on the variability in either group.
C) the population standard deviation is unknown.
D) a within-groups design is employed.
A) the sample standard deviation is unknown.
B) no comparison can be made based on the variability in either group.
C) the population standard deviation is unknown.
D) a within-groups design is employed.
Unlock Deck
Unlock for access to all 124 flashcards in this deck.
Unlock Deck
k this deck
37
The fourth step in conducting the single-sample t test is:
A) identifying a Type I error.
B) determining the critical values or cutoffs.
C) calculating the test statistic.
D) determining the characteristics of the comparison distribution.
A) identifying a Type I error.
B) determining the critical values or cutoffs.
C) calculating the test statistic.
D) determining the characteristics of the comparison distribution.
Unlock Deck
Unlock for access to all 124 flashcards in this deck.
Unlock Deck
k this deck
38
The numerator (top portion) of the ratio for calculating all t statistics contains:
A) a difference between means.
B) a variance estimate.
C) the degrees of freedom.
D) the sample mean.
A) a difference between means.
B) a variance estimate.
C) the degrees of freedom.
D) the sample mean.
Unlock Deck
Unlock for access to all 124 flashcards in this deck.
Unlock Deck
k this deck
39
H1: 1 2 is used to represent the:
A) confidence interval.
B) research hypothesis.
C) null hypothesis.
D) standard error.
A) confidence interval.
B) research hypothesis.
C) null hypothesis.
D) standard error.
Unlock Deck
Unlock for access to all 124 flashcards in this deck.
Unlock Deck
k this deck
40
The second step in conducting the single-sample t test includes:
A) identifying a Type I error.
B) identifying a Type II error.
C) checking that assumptions have been met.
D) stating the null hypothesis.
A) identifying a Type I error.
B) identifying a Type II error.
C) checking that assumptions have been met.
D) stating the null hypothesis.
Unlock Deck
Unlock for access to all 124 flashcards in this deck.
Unlock Deck
k this deck
41
A team of researchers conducted a single-sample t test and found that the 95 percent confidence interval around their sample mean includes the value of the population mean.Based on this, they should conclude that:
A) the null hypothesis should be rejected.
B) their data are insufficient to assess the validity of the null hypothesis.
C) they failed to find a significant difference between the sample and population means.
D) the research hypothesis is supported.
A) the null hypothesis should be rejected.
B) their data are insufficient to assess the validity of the null hypothesis.
C) they failed to find a significant difference between the sample and population means.
D) the research hypothesis is supported.
Unlock Deck
Unlock for access to all 124 flashcards in this deck.
Unlock Deck
k this deck
42
Imagine the average time to complete a 4-year bachelor degree is actually 4.7 years based on national data.You collect data on the 68 psychology students who started school during the same semester as you, finding an average time to complete at 4.3 years with a standard deviation of 0.6 years.What would be the effect size associated with a single-sample t test?
A) -5.48
B) -0.67
C) 0.20
D) 0.82
A) -5.48
B) -0.67
C) 0.20
D) 0.82
Unlock Deck
Unlock for access to all 124 flashcards in this deck.
Unlock Deck
k this deck
43
Imagine the average time to complete a 4-year bachelor degree is actually 4.7 years based on national data.You collect data on the 68 psychology students who started school during the same semester as you, finding an average time to complete at 4.3 years with a standard deviation of 0.6 years.What is your 95 percent confidence interval?
A) [4.23, 4.37]
B) [3.85, 4.15]
C) [4.10, 5.30]
D) [4.15, 4.45]
A) [4.23, 4.37]
B) [3.85, 4.15]
C) [4.10, 5.30]
D) [4.15, 4.45]
Unlock Deck
Unlock for access to all 124 flashcards in this deck.
Unlock Deck
k this deck
44
Use the following to answer questions
This figure represents the distribution of the percent of state residents living in a metropolitan area for all 50 U.S.states and Washington D.C.
(Figure: Percent Metropolitan) The figure indicates that:
A) most states have greater than 60 percent of their population living in metropolitan areas.
B) on average, 60 percent of all states' populations live in a metropolitan area.
C) the population of most states is concentrated in rural areas.
D) few states have larger urban centers.
Unlock Deck
Unlock for access to all 124 flashcards in this deck.
Unlock Deck
k this deck
45
For the single-sample t test, the confidence interval is centered around the:
A) sample mean.
B) population mean.
C) difference between the sample and population means.
D) standard error of the distribution of means.
A) sample mean.
B) population mean.
C) difference between the sample and population means.
D) standard error of the distribution of means.
Unlock Deck
Unlock for access to all 124 flashcards in this deck.
Unlock Deck
k this deck
46
When performing a single-sample t test, an effect size of 0.80 would be interpreted as a _____ effect.
A) small
B) medium
C) large
D) negligible
A) small
B) medium
C) large
D) negligible
Unlock Deck
Unlock for access to all 124 flashcards in this deck.
Unlock Deck
k this deck
47
The t test is a parametric statistical test that allows one to generalize what was learned about one sample to a larger population.
Unlock Deck
Unlock for access to all 124 flashcards in this deck.
Unlock Deck
k this deck
48
The final step in conducting the single-sample t test is:
A) making a decision.
B) calculating the test statistic.
C) determining the critical values.
D) identify the characteristics of the comparison distribution.
A) making a decision.
B) calculating the test statistic.
C) determining the critical values.
D) identify the characteristics of the comparison distribution.
Unlock Deck
Unlock for access to all 124 flashcards in this deck.
Unlock Deck
k this deck
49
The correct formula for the upper bound of a confidence interval for a single-sample t test is:
A) t(sM) + Msample.
B) -t(sM) - Msample.
C) t(sM) - Msample.
D) -t(sM) +Msample.
A) t(sM) + Msample.
B) -t(sM) - Msample.
C) t(sM) - Msample.
D) -t(sM) +Msample.
Unlock Deck
Unlock for access to all 124 flashcards in this deck.
Unlock Deck
k this deck
50
A researcher collects 25 data points that yield a mean of 8.164 and a standard deviation (based on N - 1) of 2.237.If the researcher is comparing the sample to a population mean of 9.2, what is the 95 percent confidence interval?
A) [6.92, 9.41]
B) [7.24, 9.09]
C) [7.75, 8.58]
D) [7.85, 10.48]
A) [6.92, 9.41]
B) [7.24, 9.09]
C) [7.75, 8.58]
D) [7.85, 10.48]
Unlock Deck
Unlock for access to all 124 flashcards in this deck.
Unlock Deck
k this deck
51
When performing a single-sample t test, an effect size of 0.20 would be interpreted as a _____ effect.
A) small
B) medium
C) large
D) negligible
A) small
B) medium
C) large
D) negligible
Unlock Deck
Unlock for access to all 124 flashcards in this deck.
Unlock Deck
k this deck
52
Two types of graphs that make it easy to see the distribution of two variables side-by-side are the:
A) histogram and dot plot.
B) stem-and-leaf plot and dot plot.
C) histogram and box plot.
D) stem-and-leaf plot and histogram.
A) histogram and dot plot.
B) stem-and-leaf plot and dot plot.
C) histogram and box plot.
D) stem-and-leaf plot and histogram.
Unlock Deck
Unlock for access to all 124 flashcards in this deck.
Unlock Deck
k this deck
53
The correct formula for the lower bound of a confidence interval for a single-sample t test is:
A) t(sM) + Msample.
B) -t(sM) - Msample.
C) t(sM) - Msample.
D) -t(sM) +Msample.
A) t(sM) + Msample.
B) -t(sM) - Msample.
C) t(sM) - Msample.
D) -t(sM) +Msample.
Unlock Deck
Unlock for access to all 124 flashcards in this deck.
Unlock Deck
k this deck
54
Based on the statistical results provided, which would lead us to fail to reject the null hypothesis?
A) t(5) = 3.2, p = 0.04
B) t(5) = 3.2, p = 0.01
C) t(5) = 3.2, p < 0.05
D) t(5) = 3.2, p > 0.05
A) t(5) = 3.2, p = 0.04
B) t(5) = 3.2, p = 0.01
C) t(5) = 3.2, p < 0.05
D) t(5) = 3.2, p > 0.05
Unlock Deck
Unlock for access to all 124 flashcards in this deck.
Unlock Deck
k this deck
55
When performing a single-sample t test, an effect size of 0.50 would be interpreted as a _____ effect.
A) small
B) medium
C) large
D) negligible
A) small
B) medium
C) large
D) negligible
Unlock Deck
Unlock for access to all 124 flashcards in this deck.
Unlock Deck
k this deck
56
A researcher conducts a single-sample t test and finds statistical significance at the 0.01 level.The effect size is then calculated and found to be 0.04.What might be concluded about the findings?
A) The findings are statistically significant, but the effect size indicates that they may not be practically significant.A very large sample may have been studied, driving up the test statistic value.
B) The findings seem flawed because without a substantial effect size, it is not possible to find statistical significance.
C) The findings are both statistically and practically significant in this case, as the effect size indicates a medium effect, and the 0.01 level of significance is rather impressive.
D) These findings are exciting because statistical significance was found with a very small effect, indicating that the results are real and the chance of a Type I error are low.
Unlock Deck
Unlock for access to all 124 flashcards in this deck.
Unlock Deck
k this deck
57
Which report of statistical results is in appropriate APA format?
A) t(5) = 1.2, fail to reject null
B) t = 1.2, df = 5, reject null
C) t(5) = 1.2, p > 0.05
D) t = 1.2, df = 5, p > 0.05
A) t(5) = 1.2, fail to reject null
B) t = 1.2, df = 5, reject null
C) t(5) = 1.2, p > 0.05
D) t = 1.2, df = 5, p > 0.05
Unlock Deck
Unlock for access to all 124 flashcards in this deck.
Unlock Deck
k this deck
58
Use the following to answer questions
This figure represents the distribution of the percent of state residents living in a metropolitan area for all 50 U.S.states and Washington D.C.
(Figure: Percent Metropolitan) The plot in the figure is a:
A) histogram.
B) stem-and-leaf plot.
C) dot plot.
D) box plot.
This figure represents the distribution of the percent of state residents living in a metropolitan area for all 50 U.S.states and Washington D.C.
(Figure: Percent Metropolitan) The plot in the figure is a:
A) histogram.
B) stem-and-leaf plot.
C) dot plot.
D) box plot.
Unlock Deck
Unlock for access to all 124 flashcards in this deck.
Unlock Deck
k this deck
59
A researcher collects 25 data points that yield a mean of 8.164 and a standard deviation (based on N - 1) of 2.237.If the researcher is comparing the sample to a population mean of 9.2 using a single-sample t test, what would be the effect size?
A) -0.60
B) -0.46
C) 0.46
D) 0.68
A) -0.60
B) -0.46
C) 0.46
D) 0.68
Unlock Deck
Unlock for access to all 124 flashcards in this deck.
Unlock Deck
k this deck
60
The correct formula for effect size using Cohen's d for a single-sample t test is:
A) (M - )/s + .
B) (M - )/s.
C) (X - )/s.
D) ( - )/s.
A) (M - )/s + .
B) (M - )/s.
C) (X - )/s.
D) ( - )/s.
Unlock Deck
Unlock for access to all 124 flashcards in this deck.
Unlock Deck
k this deck
61
A sample of 20 with a standard deviation of 92.41 results in a standard error calculated as 22.88.
Unlock Deck
Unlock for access to all 124 flashcards in this deck.
Unlock Deck
k this deck
62
The standard deviation of the population is used to estimate the standard deviation of the sample.
Unlock Deck
Unlock for access to all 124 flashcards in this deck.
Unlock Deck
k this deck
63
The single-sample t test compares the mean of a sample to a population for which the mean and standard deviation is known.
Unlock Deck
Unlock for access to all 124 flashcards in this deck.
Unlock Deck
k this deck
64
For smaller samples, the t distributions are skinnier and taller than the z distributions.
Unlock Deck
Unlock for access to all 124 flashcards in this deck.
Unlock Deck
k this deck
65
The single-sample t test compares the mean of a sample to a population for which the mean but not the standard deviation is known.
Unlock Deck
Unlock for access to all 124 flashcards in this deck.
Unlock Deck
k this deck
66
Degrees of freedom for the single-sample t test is N - 2.
Unlock Deck
Unlock for access to all 124 flashcards in this deck.
Unlock Deck
k this deck
67
There is one t distribution for all possible sample sizes.
Unlock Deck
Unlock for access to all 124 flashcards in this deck.
Unlock Deck
k this deck
68
The standard deviation of the sample is used to estimate the standard deviation of the population.
Unlock Deck
Unlock for access to all 124 flashcards in this deck.
Unlock Deck
k this deck
69
For smaller samples, the t distributions are wider and flatter than the z distributions.
Unlock Deck
Unlock for access to all 124 flashcards in this deck.
Unlock Deck
k this deck
70
The t test is used when the mean and standard deviation of the population are known.
Unlock Deck
Unlock for access to all 124 flashcards in this deck.
Unlock Deck
k this deck
71
The t statistic indicates the distance of a sample mean from a population mean in terms of estimated standard error.
Unlock Deck
Unlock for access to all 124 flashcards in this deck.
Unlock Deck
k this deck
72
Standard error is always smaller than the standard deviation because a distribution of means is less variable than that of scores.
Unlock Deck
Unlock for access to all 124 flashcards in this deck.
Unlock Deck
k this deck
73
A sample of 20 with a standard deviation of 92.41 results in a standard error calculated as 20.66.
Unlock Deck
Unlock for access to all 124 flashcards in this deck.
Unlock Deck
k this deck
74
There is one t distribution for each possible sample size.
Unlock Deck
Unlock for access to all 124 flashcards in this deck.
Unlock Deck
k this deck
75
As degrees of freedom increase, the critical cutoff for the t test decreases.
Unlock Deck
Unlock for access to all 124 flashcards in this deck.
Unlock Deck
k this deck
76
As degrees of freedom decrease, the critical cutoff for the t test decreases.
Unlock Deck
Unlock for access to all 124 flashcards in this deck.
Unlock Deck
k this deck
77
When computing standard error for the t test, divide s by the square root of N - 1.
Unlock Deck
Unlock for access to all 124 flashcards in this deck.
Unlock Deck
k this deck
78
The z test uses estimated standard error whereas the t test uses actual standard error.
Unlock Deck
Unlock for access to all 124 flashcards in this deck.
Unlock Deck
k this deck
79
When computing standard error for the t test, divide s by the square root of N.
Unlock Deck
Unlock for access to all 124 flashcards in this deck.
Unlock Deck
k this deck
80
The symbol s represents the standard deviation of the population.
Unlock Deck
Unlock for access to all 124 flashcards in this deck.
Unlock Deck
k this deck
Unlock Deck
Unlock for access to all 124 flashcards in this deck.


