Deck 10: Inference About Means and Proportions With Two Populations
Full screen (f)
Question
Independent random samples of managers' yearly salaries (in $1000s) randomly selected from governmental and private organizations provided the following information. At 95% confidence, test to determine if there is a significant difference between the average salaries of the managers in the two sectors. 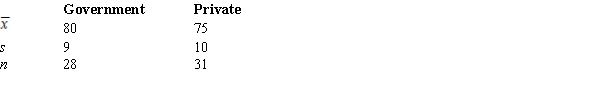
Question
Question
Question
Question
Question
A comparative study of organic and conventionally grown produce was checked for the presence of E. coli. Results are summarized below. Is there a significant difference in the proportion of E. coli in organic versus conventionally grown produce? Test at α = .10. 
Question
The following shows the monthly sales in units of six salespersons before and after a bonus plan was introduced. At 95% confidence, determine whether the bonus plan has increased sales significantly. (For the following matched samples, let d = After - Before.) 
Question
Question
Question
Question
Question
The office of records at a university has stated that the proportion of incoming female students who major in business has increased. A random sample of female students selected several years ago is compared with a random sample of female students selected this year. Results are summarized below. Has the proportion increased significantly? Test at α = .10. 
Question
Question
Question
The following data give the number of computer units sold per day by a random sample of six salespersons before and after a bonus plan was implemented.  At 95% confidence, test to see if the bonus plan was effective. That is, did the bonus plan actually increase sales?
At 95% confidence, test to see if the bonus plan was effective. That is, did the bonus plan actually increase sales? Question
The following information was obtained from matched samples regarding the productivity of four individuals using two different methods of production.  Let d = Method 1 - Method 2. Is there a significant difference between the productivity of the two methods? Let α = .05.
Let d = Method 1 - Method 2. Is there a significant difference between the productivity of the two methods? Let α = .05. Question
Question
Question
A poll was administered this year asking college students if they considered themselves overweight. A similar poll was administered five years ago. Results are summarized below. Has the proportion increased significantly? Let α = 0.05. 
Question
Question
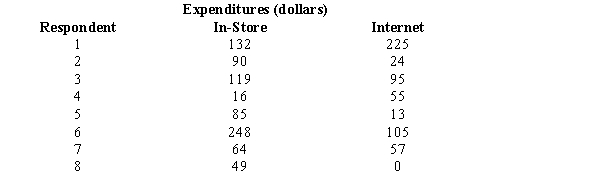
A survey was recently conducted to determine if consumers spend more on computer-related purchases via the Internet or store visits. Assume a random sample of eight respondents provided the following data on their computer-related purchases during a 30-day period. Using a .05 level of significance, can we conclude that consumers spend more on computer-related purchases by way of the Internet than by visiting stores?

Unlock Deck
Sign up to unlock the cards in this deck!
Unlock Deck
Unlock Deck
1/21
Play
Full screen (f)
Deck 10: Inference About Means and Proportions With Two Populations
1
Independent random samples of managers' yearly salaries (in $1000s) randomly selected from governmental and private organizations provided the following information. At 95% confidence, test to determine if there is a significant difference between the average salaries of the managers in the two sectors.
H0: μ1 - μ2 = 0
Ha: μ1 - μ2 ≠ 0
df = 56; test statistic t = 2.021; p-value (two-tailed) is between .02 and .05; reject H0
H0: μ1 - μ2 = 0
Ha: μ1 - μ2 ≠ 0
df = 56; test statistic t = 2.021; p-value (two-tailed) is between .02 and .05; reject H0
2
If two independent large samples are selected from two populations, the sampling distribution of the difference between the two sample means _____.
A) can be approximated by a Poisson distribution
B) will have a variance of 1
C) can be approximated by a normal distribution
D) will have a mean of 1
A) can be approximated by a Poisson distribution
B) will have a variance of 1
C) can be approximated by a normal distribution
D) will have a mean of 1
can be approximated by a normal distribution
3
A company wants to identify which of two production methods has the smaller completion time. One sample of workers is randomly selected and each worker first uses one method and then uses the other method. The sampling procedure being used to collect completion time data is based on _____ samples.
A) cross
B) pooled
C) independent
D) matched
A) cross
B) pooled
C) independent
D) matched
matched
4
In testing the null hypothesis H0: μ1 - μ2 = 0, the computed test statistic is z = -1.66. The corresponding p-value is _____.
A) .0485
B) .0970
C) .9515
D) .9030
A) .0485
B) .0970
C) .9515
D) .9030
Unlock Deck
Unlock for access to all 21 flashcards in this deck.
Unlock Deck
k this deck
5
If the alternative hypothesis is that proportion of items in population 1 is larger than the proportion of items in population 2, then the null hypothesis should be _____.
A) p1 - p2 < 0
B) p1 - p2 = 0
C) p1 - p2 > 0
D) p1 - p2 ≤ 0
A) p1 - p2 < 0
B) p1 - p2 = 0
C) p1 - p2 > 0
D) p1 - p2 ≤ 0
Unlock Deck
Unlock for access to all 21 flashcards in this deck.
Unlock Deck
k this deck
6
A comparative study of organic and conventionally grown produce was checked for the presence of E. coli. Results are summarized below. Is there a significant difference in the proportion of E. coli in organic versus conventionally grown produce? Test at α = .10.
Unlock Deck
Unlock for access to all 21 flashcards in this deck.
Unlock Deck
k this deck
7
The following shows the monthly sales in units of six salespersons before and after a bonus plan was introduced. At 95% confidence, determine whether the bonus plan has increased sales significantly. (For the following matched samples, let d = After - Before.)
Unlock Deck
Unlock for access to all 21 flashcards in this deck.
Unlock Deck
k this deck
8
To compute an interval estimate for the difference between the means of two populations, the t distribution _____.
A) is restricted to small sample situations
B) is not restricted to small sample situations
C) can be applied when the populations have equal means
D) None of the answers is correct.
A) is restricted to small sample situations
B) is not restricted to small sample situations
C) can be applied when the populations have equal means
D) None of the answers is correct.
Unlock Deck
Unlock for access to all 21 flashcards in this deck.
Unlock Deck
k this deck
9
Independent simple random samples are selected to test the difference between the means of two populations whose standard deviations are not known. We are unwilling to assume that the population variances are equal. The sample sizes are n1 = 25 and n2 = 35. The correct distribution to use is the t distribution with ______ degrees of freedom.
A) 25
B) 35
C) 58
D) The correct degrees of freedom cannot be calculated without being given the sample standard deviations.
A) 25
B) 35
C) 58
D) The correct degrees of freedom cannot be calculated without being given the sample standard deviations.
Unlock Deck
Unlock for access to all 21 flashcards in this deck.
Unlock Deck
k this deck
10
The sampling distribution of is approximated by a _____.
A) normal distribution
B) t distribution with n1 + n2 degrees of freedom
C) t distribution with n1 + n2 - 1 degrees of freedom
D) t distribution with n1 + n2 + 2 degrees of freedom
A) normal distribution
B) t distribution with n1 + n2 degrees of freedom
C) t distribution with n1 + n2 - 1 degrees of freedom
D) t distribution with n1 + n2 + 2 degrees of freedom
Unlock Deck
Unlock for access to all 21 flashcards in this deck.
Unlock Deck
k this deck
11
When developing an interval estimate for the difference between two sample means, with sample sizes of n1 and n2, _____.
A) n1 must be equal to n2
B) n1 must be smaller than n2
C) n1 must be larger than n2
D) n1 and n2 can be of different sizes
A) n1 must be equal to n2
B) n1 must be smaller than n2
C) n1 must be larger than n2
D) n1 and n2 can be of different sizes
Unlock Deck
Unlock for access to all 21 flashcards in this deck.
Unlock Deck
k this deck
12
The office of records at a university has stated that the proportion of incoming female students who major in business has increased. A random sample of female students selected several years ago is compared with a random sample of female students selected this year. Results are summarized below. Has the proportion increased significantly? Test at α = .10.
Unlock Deck
Unlock for access to all 21 flashcards in this deck.
Unlock Deck
k this deck
13
To construct an interval estimate for the difference between the means of two populations when the standard deviations of the two populations are unknown, we must use a t distribution with (let n1 be the size of sample 1 and n2 the size of sample 2) _____ degrees of freedom.
A) n1 + n2
B) n1 + n2 - 1
C) n1 + n2 - 2
D) n1 - n2 + 2
A) n1 + n2
B) n1 + n2 - 1
C) n1 + n2 - 2
D) n1 - n2 + 2
Unlock Deck
Unlock for access to all 21 flashcards in this deck.
Unlock Deck
k this deck
14
In a sample of 100 Republicans, 60 favored the president's anti-drug program. While in a sample of 150 Democrats, 84 favored his program. At 95% confidence, test to see if there is a significant difference in the proportions of the Democrats and the Republicans who favored the president's anti-drug program.
Unlock Deck
Unlock for access to all 21 flashcards in this deck.
Unlock Deck
k this deck
15
The following data give the number of computer units sold per day by a random sample of six salespersons before and after a bonus plan was implemented. At 95% confidence, test to see if the bonus plan was effective. That is, did the bonus plan actually increase sales?
At 95% confidence, test to see if the bonus plan was effective. That is, did the bonus plan actually increase sales? Unlock Deck
Unlock for access to all 21 flashcards in this deck.
Unlock Deck
k this deck
16
The following information was obtained from matched samples regarding the productivity of four individuals using two different methods of production. Let d = Method 1 - Method 2. Is there a significant difference between the productivity of the two methods? Let α = .05.
Let d = Method 1 - Method 2. Is there a significant difference between the productivity of the two methods? Let α = .05. Unlock Deck
Unlock for access to all 21 flashcards in this deck.
Unlock Deck
k this deck
17
The standard error of is the _____.
A) variance of
B) variance of the sampling distribution of
C) standard deviation of the sampling distribution of
D) difference between the two means
A) variance of
B) variance of the sampling distribution of
C) standard deviation of the sampling distribution of
D) difference between the two means
Unlock Deck
Unlock for access to all 21 flashcards in this deck.
Unlock Deck
k this deck
18
Independent simple random samples are selected to test the difference between the means of two populations whose variances are not known. The sample sizes are n1 = 32 and n2 = 40. The correct distribution to use is the _____ distribution.
A) binomial
B) t
C) normal
D) uniform
A) binomial
B) t
C) normal
D) uniform
Unlock Deck
Unlock for access to all 21 flashcards in this deck.
Unlock Deck
k this deck
19
A poll was administered this year asking college students if they considered themselves overweight. A similar poll was administered five years ago. Results are summarized below. Has the proportion increased significantly? Let α = 0.05.
Unlock Deck
Unlock for access to all 21 flashcards in this deck.
Unlock Deck
k this deck
20
When each data value in one sample is matched with a corresponding data value in another sample, the samples are known as _____.
A) corresponding samples
B) matched samples
C) independent samples
D) None of the answers is correct.
A) corresponding samples
B) matched samples
C) independent samples
D) None of the answers is correct.
Unlock Deck
Unlock for access to all 21 flashcards in this deck.
Unlock Deck
k this deck
21
A survey was recently conducted to determine if consumers spend more on computer-related purchases via the Internet or store visits. Assume a random sample of eight respondents provided the following data on their computer-related purchases during a 30-day period. Using a .05 level of significance, can we conclude that consumers spend more on computer-related purchases by way of the Internet than by visiting stores?
Unlock Deck
Unlock for access to all 21 flashcards in this deck.
Unlock Deck
k this deck
Unlock Deck
Unlock for access to all 21 flashcards in this deck.


