Deck 8: Probability
Full screen (f)
Question
Question
Question
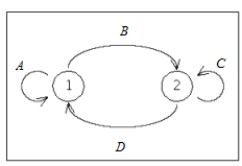
Which of the following represents the transition matrix for the state diagram below. ![<strong>Which of the following represents the transition matrix for the state diagram below. A = \frac { 3 } { 4 } , B = \frac { 1 } { 4 } , C = \frac { 3 } { 5 } , D = \frac { 2 } { 5 } </strong> A) \left[ \begin{array} { l l } \frac { 3 } { 4 } & \frac { 2 } { 5 } \\\\ \frac { 1 } { 4 } & \frac { 3 } { 5 } \end{array} \right] B) \left[ \begin{array} { l l } \frac { 1 } { 4 } & \frac { 3 } { 4 } \\\\ \frac { 2 } { 5 } & \frac { 3 } { 5 } \end{array} \right] C) \left[ \begin{array} { l l } \frac { 3 } { 4 } & \frac { 1 } { 4 } \\\\ \frac { 2 } { 5 } & \frac { 3 } { 5 } \end{array} \right] D) \left[ \begin{array} { l l } \frac { 3 } { 5 } & \frac { 1 } { 4 } \\\\ \frac { 2 } { 5 } & \frac { 3 } { 4 } \end{array} \right] E) \left[ \begin{array} { l l } \frac { 3 } { 5 } & \frac { 2 } { 5 } \\\\ \frac { 1 } { 4 } & \frac { 3 } { 4 } \end{array} \right] <div style=padding-top: 35px>](https://storage.examlex.com/TB6226/11eb0df5_e552_3305_9431_d71f6f0ca072_TB6226_00.jpg) , , ,
, , ,
A)
B)
C)
D)
E)
, , , A)
B)
C)
D)
E)
Question
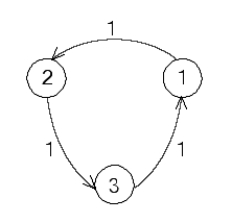
Write down the transition matrix associated with the state transition diagram. ![<strong>Write down the transition matrix associated with the state transition diagram. </strong> A)The transition matrix is \left[ \begin{array} { c c c } 0 & \frac { 1 } { 2 } & \frac { 1 } { 2 } \\ \frac { 1 } { 2 } & 0 & \frac { 1 } { 2 } \\ \frac { 1 } { 2 } & \frac { 1 } { 2 } & 0 \end{array} \right] B) The transition matrix is \left[ \begin{array} { l l l } 1 & 0 & 0 \\ 0 & 1 & 0 \\ 0 & 0 & 1 \end{array} \right] C) The transition matrix is \left[ \begin{array} { l l l } 0 & 1 & 0 \\ 0 & 0 & 1 \\ 1 & 0 & 0 \end{array} \right] D) The transition matrix is \left[ \begin{array} { l l l } 0 & 0 & 1 \\ 1 & 0 & 0 \\ 0 & 1 & 0 \end{array} \right] E) The transition matrix is \left[ \begin{array} { l l l } 0 & 0 & 1 \\ 0 & 1 & 0 \\ 1 & 0 & 0 \end{array} \right] <div style=padding-top: 35px>](https://storage.examlex.com/TB6226/11eb0df5_e554_2e26_9431_db0baaabc4ce_TB6226_00.jpg)
A)The transition matrix is
B) The transition matrix is
C) The transition matrix is
D) The transition matrix is
E) The transition matrix is
A)The transition matrix is
B) The transition matrix is
C) The transition matrix is
D) The transition matrix is
E) The transition matrix is
Question
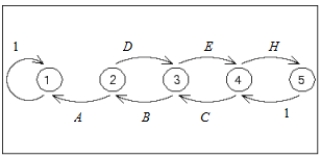
Write down the transition matrix associated with the given state transition diagram. ![<strong>Write down the transition matrix associated with the given state transition diagram. A = B = C = \frac { 1 } { 3 } , D = E = H = \frac { 2 } { 3 } </strong> A) P = \left[ \begin{array} { c c c c c } 1 & 0 & 0 & 0 & 0 \\ \frac { 2 } { 3 } & 0 & \frac { 1 } { 3 } & 0 & 0 \\ 0 & \frac { 2 } { 3 } & 0 & \frac { 1 } { 3 } & 0 \\ 0 & 0 & \frac { 2 } { 3 } & 0 & \frac { 1 } { 3 } \\ 0 & 0 & 0 & 0 & 1 \end{array} \right] B) P = \left[ \begin{array} { c c c c c } 1 & 0 & 0 & 0 & 0 \\ \frac { 2 } { 3 } & 0 & \frac { 1 } { 3 } & 0 & 0 \\ 0 & \frac { 2 } { 3 } & 0 & \frac { 1 } { 3 } & 0 \\ 0 & 0 & \frac { 2 } { 3 } & 0 & \frac { 1 } { 3 } \\ 0 & 0 & 0 & 1 & 0 \end{array} \right] C) P = \left[ \begin{array} { c c c c c } 1 & 0 & 0 & 0 & 0 \\ \frac { 1 } { 3 } & 0 & \frac { 2 } { 3 } & 0 & 0 \\ 0 & \frac { 1 } { 3 } & 0 & \frac { 2 } { 3 } & 0 \\ 0 & 0 & \frac { 1 } { 3 } & 0 & \frac { 2 } { 3 } \\ 0 & 0 & 0 & 1 & 0 \end{array} \right] D) P = \left[ \begin{array} { c c c c c } 0 & 1 & 0 & 0 & 0 \\ \frac { 1 } { 3 } & 0 & \frac { 2 } { 3 } & 0 & 0 \\ 0 & \frac { 1 } { 3 } & 0 & \frac { 2 } { 3 } & 0 \\ 0 & 0 & \frac { 1 } { 3 } & 0 & \frac { 2 } { 3 } \\ 0 & 0 & 0 & 1 & 0 \end{array} \right] E) P = \left[ \begin{array} { c c c c c } 1 & 0 & 0 & 0 & 0 \\ \frac { 1 } { 3 } & 0 & \frac { 2 } { 3 } & 0 & 0 \\ 0 & \frac { 1 } { 3 } & 0 & \frac { 2 } { 3 } & 0 \\ 0 & 0 & \frac { 1 } { 3 } & 0 & \frac { 2 } { 3 } \\ 0 & 0 & 0 & 0 & 1 \end{array} \right] <div style=padding-top: 35px>](https://storage.examlex.com/TB6226/11eb0df5_e552_cf5e_9431_33ec982eb48b_TB6226_00.jpg) ,
,
A)
B)
C)
D)
E)
, A)
B)
C)
D)
E)
Question
Question
Question
Question
Question
Write down the transition matrix associated with the given state transition diagram below. ![<strong>Write down the transition matrix associated with the given state transition diagram below. A = \frac { 1 } { 4 } , B = \frac { 3 } { 4 } , C = \frac { 1 } { 3 } , D = \frac { 2 } { 3 } </strong> A) P = \left[ \begin{array} { l l } \frac { 1 } { 4 } & \frac { 3 } { 4 } \\ \frac { 3 } { 4 } & \frac { 3 } { 3 } \end{array} \right] B) P = \left[ \begin{array} { l l } \frac { 1 } { 4 } & \frac { 3 } { 4 } \\ \frac { 2 } { 3 } & \frac { 1 } { 3 } \end{array} \right] C) P = \left[ \begin{array} { l l } \frac { 3 } { 4 } & \frac { 1 } { 4 } \\ \frac { 1 } { 3 } & \frac { 2 } { 3 } \end{array} \right] D) P = \left[ \begin{array} { l l } \frac { 3 } { 4 } & \frac { 1 } { 4 } \\ \frac { 2 } { 3 } & \frac { 1 } { 4 } \end{array} \right] E) P = \left[ \begin{array} { l l } \frac { 1 } { 3 } & \frac { 3 } { 4 } \\ \frac { 2 } { 3 } & \frac { 1 } { 4 } \end{array} \right] <div style=padding-top: 35px>](https://storage.examlex.com/TB6226/11eb0df5_e552_8134_9431_adfcc8af0555_TB6226_00.jpg)
, , ,
A)
B)
C)
D)
E)
, , ,
A)
B)
C)
D)
E)
Question
Question
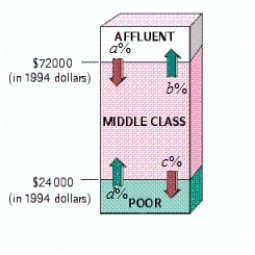
The following diagram shows the movement of U.S. households among three income groups - affluent, middle class, and poor - over the 12-year period 1965-1977. Assuming that the trend shown was to continue, what percent of households classified as affluent in 1965 were predicted to become poor in 1989 (Give your answer to the nearest .) According to the model, what percentage of all U.S. households will be in each income bracket in the long term (Give your answer to the nearest percent.)  , , ,
, , ,
A)6% of households classified as affluent in 1965 were predicted to become poor in 1989. In the long term: Affluent: 22.9%; Middle class: 39.1%; Poor: 38.1%
B) 1.8% of households classified as affluent in 1965 were predicted to become poor in 1989. In the long term: Affluent: 30.1%; Middle class: 5.9%; Poor: 64%
C) 6% of households classified as affluent in 1965 were predicted to become poor in 1989. In the long term: Affluent: 30.1%; Middle class: 5.9%; Poor: 64%
D) 0% of households classified as affluent in 1965 were predicted to become poor in 1989. In the long term: Affluent: 30.1%; Middle class: 5.9%; Poor: 64%
E) 0% of households classified as affluent in 1965 were predicted to become poor in 1989. In the long term: Affluent: 15.6%; Middle class: 72.3%; Poor: 12.1%
, , , A)6% of households classified as affluent in 1965 were predicted to become poor in 1989. In the long term: Affluent: 22.9%; Middle class: 39.1%; Poor: 38.1%
B) 1.8% of households classified as affluent in 1965 were predicted to become poor in 1989. In the long term: Affluent: 30.1%; Middle class: 5.9%; Poor: 64%
C) 6% of households classified as affluent in 1965 were predicted to become poor in 1989. In the long term: Affluent: 30.1%; Middle class: 5.9%; Poor: 64%
D) 0% of households classified as affluent in 1965 were predicted to become poor in 1989. In the long term: Affluent: 30.1%; Middle class: 5.9%; Poor: 64%
E) 0% of households classified as affluent in 1965 were predicted to become poor in 1989. In the long term: Affluent: 15.6%; Middle class: 72.3%; Poor: 12.1%
Question
Question
Question
The following diagram shows the movement of U.S. households among three income groups - affluent, middle class, and poor - over the 11-year period 1982-1993. Assuming that the trend shown was to continue, what percent of households classified as affluent in 1982 were predicted to become poor in 2004 (Give your answer to the nearest .) According to the model, what percentage of all U.S. households will be in each income bracket in the long term (Give your answer to the nearest percent.)  , , ,
, , ,
A)0.3% of households classified as affluent in 1982 were predicted to become poor in 2004. In the long term: Affluent: 22.7%; Middle class: 36.3%; Poor: 41.1%
B) 0% of households classified as affluent in 1982 were predicted to become poor in 2004.
In the long term: Affluent: 26.5%; Middle class: 8.1%; Poor: 65.4%
C) 0% of households classified as affluent in 1982 were predicted to become poor in 2004.
In the long term: Affluent: 18.9%; Middle class: 64.4%; Poor: 16.7%
D) 0.3% of households classified as affluent in 1982 were predicted to become poor in 2004.
In the long term: Affluent: 26.5%; Middle class: 8.1% ; Poor: 65.4%
E) 2.1% of households classified as affluent in 1982 were predicted to become poor in 2004.
In the long term: Affluent: 26.5%; Middle class: 8.1%; Poor: 65.4%
, , , A)0.3% of households classified as affluent in 1982 were predicted to become poor in 2004. In the long term: Affluent: 22.7%; Middle class: 36.3%; Poor: 41.1%
B) 0% of households classified as affluent in 1982 were predicted to become poor in 2004.
In the long term: Affluent: 26.5%; Middle class: 8.1%; Poor: 65.4%
C) 0% of households classified as affluent in 1982 were predicted to become poor in 2004.
In the long term: Affluent: 18.9%; Middle class: 64.4%; Poor: 16.7%
D) 0.3% of households classified as affluent in 1982 were predicted to become poor in 2004.
In the long term: Affluent: 26.5%; Middle class: 8.1% ; Poor: 65.4%
E) 2.1% of households classified as affluent in 1982 were predicted to become poor in 2004.
In the long term: Affluent: 26.5%; Middle class: 8.1%; Poor: 65.4%
Question
Question
Question
Question
Question
Question
Question
Question
Question
Question
Question
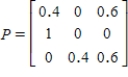
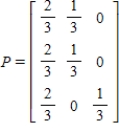
You are given a transition matrix P. Find the steady-state distribution vector.
Question
Question
The following diagram shows the movement of U.S. households among three income groups - affluent, middle class, and poor - over the 11-year period 1982-1993.
 ? , , , ?
Use the transitions shown in the diagram to construct a transition matrix (assuming zero probabilities for the transitions between affluent and poor).
Take 1 = Affluent, 2 = Middle class, 3 = Poor.
Assuming that the trend shown was to continue, what percent of households classified as affluent in 1982 were predicted to become poor in 2004 (Give your answer to the nearest 0.1%.)
The answer is __________%
According to the model, what percentage of all U.S. households will be in each income bracket in the long term (Give your answers to the nearest 0.1 percent.)
Percent of affluent is __________%
Percent of middle class is __________%
Percent of poor is __________%
? , , , ?Use the transitions shown in the diagram to construct a transition matrix (assuming zero probabilities for the transitions between affluent and poor).
Take 1 = Affluent, 2 = Middle class, 3 = Poor.
Assuming that the trend shown was to continue, what percent of households classified as affluent in 1982 were predicted to become poor in 2004 (Give your answer to the nearest 0.1%.)
The answer is __________%
According to the model, what percentage of all U.S. households will be in each income bracket in the long term (Give your answers to the nearest 0.1 percent.)
Percent of affluent is __________%
Percent of middle class is __________%
Percent of poor is __________%
Question
You are given a transition matrix P. Find the steady-state distribution vector.

Question
Question
You are given a transition matrix P. Find the steady-state distribution vector.
Question
Write down the transition matrix associated with the given state transition diagram below.
 ,
,  ,
,  ,
, 
, , , Question
The following diagram shows the movement of U.S. households among three income groups - affluent, middle class, and poor - over the 11-year period 1978-1989.
 ? , , , ?
Use the transitions shown in the diagram to construct a transition matrix (assuming zero probabilities for the transitions between affluent and poor).
Take 1 = Affluent, 2 = Middle class, 3 = Poor.
Assuming that the trend shown was to continue, what percent of households classified as affluent in 1978 were predicted to become poor in 2000 (Give your answer to the nearest 0.1%.)
The answer is __________%
According to the model, what percentage of all U.S. households will be in each income bracket in the long term (Give your answers to the nearest 0.1 percent.)
Percent of affluent is __________%
Percent of middle class is __________%
Percent of poor is __________%
? , , , ?Use the transitions shown in the diagram to construct a transition matrix (assuming zero probabilities for the transitions between affluent and poor).
Take 1 = Affluent, 2 = Middle class, 3 = Poor.
Assuming that the trend shown was to continue, what percent of households classified as affluent in 1978 were predicted to become poor in 2000 (Give your answer to the nearest 0.1%.)
The answer is __________%
According to the model, what percentage of all U.S. households will be in each income bracket in the long term (Give your answers to the nearest 0.1 percent.)
Percent of affluent is __________%
Percent of middle class is __________%
Percent of poor is __________%
Question
Question
Question
Write down the transition matrix associated with the state transition diagram.
Question
Question
Question
Write down the transition matrix associated with the given state transition diagram.
 ,
,  ,
,  ,
,  ,
,  ,
, 
, , , , , Question
Write down the transition matrix associated with the given state transition diagram below.

 ,
,  ,
,  ,
, 
, , , Question
Question
Question
Question
Question
Use Bayes' theorem or a tree diagram to calculate the indicated probability. Round the answer to four decimal places.
 ,
,  ,
,  form a partition of S.
 ,
,  ,
,  ,
,  ,
,  .
.
Find .
.
 __________
, , form a partition of S.
, , , , .
Find
.
__________ Question
Question
Question
Question
Question
Question
Question
Question
Question
Use Bayes' theorem or a tree diagram to calculate the indicated probability. Round the answer to four decimal places.
 ,
,  ,
,  form a partition of S.
 ,
,  ,
,  ,
,  ,
,  .
.
Find .
.
 __________
, , form a partition of S.
, , , , .
Find
.
__________ Question
Question
Question
Question
Use Bayes' theorem or a tree diagram to calculate the indicated probability. Round the answer to four decimal places.
 ,
,  ,
,  form a partition of S.
 ,
,  ,
,  ,
,  ,
,  .
.
Find .
.
 __________
, , form a partition of S.
, , , , .
Find
.
__________ Question
Use Bayes' Theorem to calculate  when
when  ,
,  ,
,  . Please round the answer to three decimal places.
 __________
when , , . Please round the answer to three decimal places.
__________ Question
Question
Question
Question
Question
Question
Question
Question
Question
Question
Question
Question
Question
Question
Question
Question
Question
Compute the following quantities. , , , and 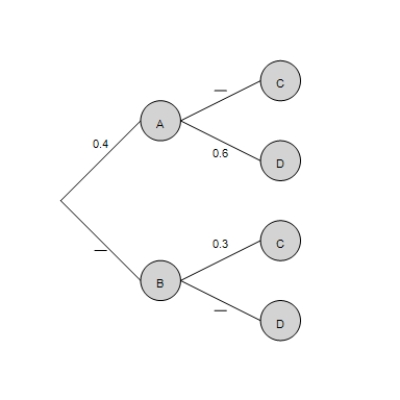
A) , , , and
B) , , , and
C) , , , and
D) , , , and
E) , , , and
A) , , , and
B) , , , and
C) , , , and
D) , , , and
E) , , , and
Question
Question
Question
Question

Unlock Deck
Sign up to unlock the cards in this deck!
Unlock Deck
Unlock Deck
1/257
Play
Full screen (f)
Deck 8: Probability
1
Tommy the dunker's performance on the basketball court is influenced by his state of mind. If Tommy missed a shot last time, he has a 40% chance of scoring next time; whereas, if he scored last time, he has a 50% chance of scoring next time. If Tommy has just scored, what are his chances of scoring 5 shots from now ?
A)0.35455
B) 0.65455
C) 0.54544
D) 0.54545
E) 0.45455
A)0.35455
B) 0.65455
C) 0.54544
D) 0.54545
E) 0.45455
0.45455
2
Use the given transition matrix P and the given initial distribution vector v to obtain the two-step transition matrix and the distribution vector after two steps. ,
A)The two-step transition matrix is The distribution vector is
B) The two-step transition matrix is
The distribution vector is
C) The two-step transition matrix is
The distribution vector is
D) The two-step transition matrix is
The distribution vector is
E) The two-step transition matrix is
The distribution vector is
The two-step transition matrix is
The distribution vector is
The distribution vector is
3
Which of the following represents the transition matrix for the state diagram below. , , ,
A)
B)
C)
D)
E)
, , , A)
B)
C)
D)
E)
4
Write down the transition matrix associated with the state transition diagram.
A)The transition matrix is
B) The transition matrix is
C) The transition matrix is
D) The transition matrix is
E) The transition matrix is
A)The transition matrix is
B) The transition matrix is
C) The transition matrix is
D) The transition matrix is
E) The transition matrix is
Unlock Deck
Unlock for access to all 257 flashcards in this deck.
Unlock Deck
k this deck
5
Write down the transition matrix associated with the given state transition diagram. ,
A)
B)
C)
D)
E)
, A)
B)
C)
D)
E)
Unlock Deck
Unlock for access to all 257 flashcards in this deck.
Unlock Deck
k this deck
6
Use the given transition matrix P and the given initial distribution vector v to obtain the two-step transition matrix and the distribution vector after two steps. ,
A)The two-step transition matrix is The distribution vector is
B) The two-step transition matrix is
The distribution vector is
C) The two-step transition matrix is
The distribution vector is
D) The two-step transition matrix is
The distribution vector is
E) The two-step transition matrix is
The distribution vector is
A)The two-step transition matrix is The distribution vector is
B) The two-step transition matrix is
The distribution vector is
C) The two-step transition matrix is
The distribution vector is
D) The two-step transition matrix is
The distribution vector is
E) The two-step transition matrix is
The distribution vector is
Unlock Deck
Unlock for access to all 257 flashcards in this deck.
Unlock Deck
k this deck
7
You are given a transition matrix P. Find the steady-state distribution vector.
A)The steady-state distribution vector is
B) The steady-state distribution vector is
C) The steady-state distribution vector is
D) The steady-state distribution vector is
E) The steady-state distribution vector is
A)The steady-state distribution vector is
B) The steady-state distribution vector is
C) The steady-state distribution vector is
D) The steady-state distribution vector is
E) The steady-state distribution vector is
Unlock Deck
Unlock for access to all 257 flashcards in this deck.
Unlock Deck
k this deck
8
You are given a transition matrix P. Find the steady-state distribution vector.
A)The steady-state distribution vector is
B) The steady-state distribution vector is
C) The steady-state distribution vector is
D) The steady-state distribution vector is
E) The steady-state distribution vector is
A)The steady-state distribution vector is
B) The steady-state distribution vector is
C) The steady-state distribution vector is
D) The steady-state distribution vector is
E) The steady-state distribution vector is
Unlock Deck
Unlock for access to all 257 flashcards in this deck.
Unlock Deck
k this deck
9
You are given a transition matrix P and initial distribution vector v. Find the two-step transition matrix and the distribution vector after two steps.
,
A)The two-step transition matrix is The distribution vector after two steps is
B) The two-step transition matrix is
The distribution vector after two steps is
C) The two-step transition matrix is
The distribution vector after two steps is
D) The two-step transition matrix is
The distribution vector after two steps is
E) The two-step transition matrix is
The distribution vector after two steps is
Unlock Deck
Unlock for access to all 257 flashcards in this deck.
Unlock Deck
k this deck
10
Write down the transition matrix associated with the given state transition diagram below.
, , ,
A)
B)
C)
D)
E)
, , ,
A)
B)
C)
D)
E)
Unlock Deck
Unlock for access to all 257 flashcards in this deck.
Unlock Deck
k this deck
11
You are given a transition matrix P. Find the steady-state distribution vector.
A)The steady-state distribution vector is
B) The steady-state distribution vector is
C) The steady-state distribution vector is
D) The steady-state distribution vector is
E) The steady-state distribution vector is
A)The steady-state distribution vector is
B) The steady-state distribution vector is
C) The steady-state distribution vector is
D) The steady-state distribution vector is
E) The steady-state distribution vector is
Unlock Deck
Unlock for access to all 257 flashcards in this deck.
Unlock Deck
k this deck
12
The following diagram shows the movement of U.S. households among three income groups - affluent, middle class, and poor - over the 12-year period 1965-1977. Assuming that the trend shown was to continue, what percent of households classified as affluent in 1965 were predicted to become poor in 1989 (Give your answer to the nearest .) According to the model, what percentage of all U.S. households will be in each income bracket in the long term (Give your answer to the nearest percent.) , , ,
A)6% of households classified as affluent in 1965 were predicted to become poor in 1989. In the long term: Affluent: 22.9%; Middle class: 39.1%; Poor: 38.1%
B) 1.8% of households classified as affluent in 1965 were predicted to become poor in 1989. In the long term: Affluent: 30.1%; Middle class: 5.9%; Poor: 64%
C) 6% of households classified as affluent in 1965 were predicted to become poor in 1989. In the long term: Affluent: 30.1%; Middle class: 5.9%; Poor: 64%
D) 0% of households classified as affluent in 1965 were predicted to become poor in 1989. In the long term: Affluent: 30.1%; Middle class: 5.9%; Poor: 64%
E) 0% of households classified as affluent in 1965 were predicted to become poor in 1989. In the long term: Affluent: 15.6%; Middle class: 72.3%; Poor: 12.1%
, , , A)6% of households classified as affluent in 1965 were predicted to become poor in 1989. In the long term: Affluent: 22.9%; Middle class: 39.1%; Poor: 38.1%
B) 1.8% of households classified as affluent in 1965 were predicted to become poor in 1989. In the long term: Affluent: 30.1%; Middle class: 5.9%; Poor: 64%
C) 6% of households classified as affluent in 1965 were predicted to become poor in 1989. In the long term: Affluent: 30.1%; Middle class: 5.9%; Poor: 64%
D) 0% of households classified as affluent in 1965 were predicted to become poor in 1989. In the long term: Affluent: 30.1%; Middle class: 5.9%; Poor: 64%
E) 0% of households classified as affluent in 1965 were predicted to become poor in 1989. In the long term: Affluent: 15.6%; Middle class: 72.3%; Poor: 12.1%
Unlock Deck
Unlock for access to all 257 flashcards in this deck.
Unlock Deck
k this deck
13
Tommy the dunker's performance on the basketball court is influenced by his state of mind. If he scores, he is three times as likely to score on the next shot as he is to miss; whereas, if he misses a shot he is four times as likely to miss the next shot as he is to score. In the long term, what percentage of shots are successful
A)
B)
C)
D)
E)
A)
B)
C)
D)
E)
Unlock Deck
Unlock for access to all 257 flashcards in this deck.
Unlock Deck
k this deck
14
Adoptions College instructors who adopt this book are (we hope!) three times as likely to continue to use the book the following semester as they are to drop it, whereas nonusers are eight times as likely to remain nonusers the following year as they are to adopt this book. Determine the probability that a nonuser will be a user in two years. In the long term, what proportion of college instructors will be users of this book
A)The probability that a nonuser will be a user in two years is . Proportion of college instructors is .
B) The probability that a nonuser will be a user in two years is .
Proportion of college instructors is .
C) The probability that a nonuser will be a user in two years is .
Proportion of college instructors is .
D) The probability that a nonuser will be a user in two years is .
Proportion of college instructors is .
E) The probability that a nonuser will be a user in two years is .
Proportion of college instructors is .
Unlock Deck
Unlock for access to all 257 flashcards in this deck.
Unlock Deck
k this deck
15
The following diagram shows the movement of U.S. households among three income groups - affluent, middle class, and poor - over the 11-year period 1982-1993. Assuming that the trend shown was to continue, what percent of households classified as affluent in 1982 were predicted to become poor in 2004 (Give your answer to the nearest .) According to the model, what percentage of all U.S. households will be in each income bracket in the long term (Give your answer to the nearest percent.) , , ,
A)0.3% of households classified as affluent in 1982 were predicted to become poor in 2004. In the long term: Affluent: 22.7%; Middle class: 36.3%; Poor: 41.1%
B) 0% of households classified as affluent in 1982 were predicted to become poor in 2004.
In the long term: Affluent: 26.5%; Middle class: 8.1%; Poor: 65.4%
C) 0% of households classified as affluent in 1982 were predicted to become poor in 2004.
In the long term: Affluent: 18.9%; Middle class: 64.4%; Poor: 16.7%
D) 0.3% of households classified as affluent in 1982 were predicted to become poor in 2004.
In the long term: Affluent: 26.5%; Middle class: 8.1% ; Poor: 65.4%
E) 2.1% of households classified as affluent in 1982 were predicted to become poor in 2004.
In the long term: Affluent: 26.5%; Middle class: 8.1%; Poor: 65.4%
, , , A)0.3% of households classified as affluent in 1982 were predicted to become poor in 2004. In the long term: Affluent: 22.7%; Middle class: 36.3%; Poor: 41.1%
B) 0% of households classified as affluent in 1982 were predicted to become poor in 2004.
In the long term: Affluent: 26.5%; Middle class: 8.1%; Poor: 65.4%
C) 0% of households classified as affluent in 1982 were predicted to become poor in 2004.
In the long term: Affluent: 18.9%; Middle class: 64.4%; Poor: 16.7%
D) 0.3% of households classified as affluent in 1982 were predicted to become poor in 2004.
In the long term: Affluent: 26.5%; Middle class: 8.1% ; Poor: 65.4%
E) 2.1% of households classified as affluent in 1982 were predicted to become poor in 2004.
In the long term: Affluent: 26.5%; Middle class: 8.1%; Poor: 65.4%
Unlock Deck
Unlock for access to all 257 flashcards in this deck.
Unlock Deck
k this deck
16
You are given a transition matrix P and initial distribution vector v. Find the two-step transition matrix and the distribution vector after two steps.
,
A)The two-step transition matrix is The distribution vector after two steps is
B) The two-step transition matrix is
The distribution vector after two steps is
C) The two-step transition matrix is
The distribution vector after two steps is
D) The two-step transition matrix is
The distribution vector after two steps is
E) The two-step transition matrix is
The distribution vector after two steps is
,
A)The two-step transition matrix is The distribution vector after two steps is
B) The two-step transition matrix is
The distribution vector after two steps is
C) The two-step transition matrix is
The distribution vector after two steps is
D) The two-step transition matrix is
The distribution vector after two steps is
E) The two-step transition matrix is
The distribution vector after two steps is
Unlock Deck
Unlock for access to all 257 flashcards in this deck.
Unlock Deck
k this deck
17
A University of Kansas study shows the following one-generation transition probabilities among four major income groups. In the long term, what percentage of male earners would you expect to find in each category
A)Bottom 10%: 35.79% 10-50%: 14.21%
50-90%: 14.21%
Top 10%: 35.79%
B) Bottom 10%: 13.21%
10-50%: 36.79%
50-90%: 36.79%
Top 10%: 13.21%
C) Bottom 10%: 36.79%
10-50%: 13.21%
50-90%: 13.21%
Top 10%: 36.79%
D) Bottom 10%: 14.21%
10-50%: 35.79%
50-90%: 35.79%
Top 10%: 14.21%
E) Bottom 10%: 10%
10-50%: 40%
50-90%: 40%
Top 10%: 10%
Unlock Deck
Unlock for access to all 257 flashcards in this deck.
Unlock Deck
k this deck
18
You have worked for the Department of Administrative Affairs (DAA) for 27 years, and you still have little or no idea exactly what your job entails. To make your life a little more interesting, you have decided on the following course of action. Every Friday afternoon, you will use your desktop computer to generate a random digit from 0 to 9 (inclusive). If the digit is a eight or greater, you will immediately quit your job, never to return. Otherwise, you will return to work the following Monday. What is the probability that you will still be employed by the DAA after each of the next three weeks ?
A)0.992
B) 0.64
C) 0.512
D) 1
E) 0.8
A)0.992
B) 0.64
C) 0.512
D) 1
E) 0.8
Unlock Deck
Unlock for access to all 257 flashcards in this deck.
Unlock Deck
k this deck
19
In an experiment to test the effectiveness of the latest roach trap, the "Roach Resort"; 70 roaches were placed in the vicinity of the trap and left there for an hour. At the end of the hour, it was observed that 42 of them had "checked in" while the rest were still scurrying around. (Remember that "once a roach checks in, it never checks out.") If a roach begins outside the "Resort", what is the probability of it "checking in" by the end of 3 hours ?
A)0.4
B) 1
C) 0.36
D) 0.936
E) 0.216
A)0.4
B) 1
C) 0.36
D) 0.936
E) 0.216
Unlock Deck
Unlock for access to all 257 flashcards in this deck.
Unlock Deck
k this deck
20
A market survey shows that one third of the owners of Sorey State Boogie Boards became disenchanted with the product and switched to C&T Super Professional Boards the next surf season, while the other remained loyal to Sorey State. On the other hand, four fifths of the C&T Boogie Board users remained loyal to C&T, while the rest switched to Sorey State. Set these data up as a Markov transition matrix, and calculate the probability that a Sorey State Board user will be using the same brand two seasons later.
Take 1 = Sorey State, 2 = C&T.
A)The probability is .
B) The probability is .
C) The probability is .
D) The probability is .
E) The probability is .
Take 1 = Sorey State, 2 = C&T.
A)The probability is .
B) The probability is .
C) The probability is .
D) The probability is .
E) The probability is .
Unlock Deck
Unlock for access to all 257 flashcards in this deck.
Unlock Deck
k this deck
21
Tommy the Dunker's performance on the basketball court is influenced by his state of mind: If he scores, he is twice as likely to score on the next shot as he is to miss, whereas if he misses a shot, he is four times as likely to miss the next shot as he is to score. In the long term, what percentage of shots are successful
Unlock Deck
Unlock for access to all 257 flashcards in this deck.
Unlock Deck
k this deck
22
Use Bayes' theorem or a tree diagram to calculate the indicated probability. Round the answer to four decimal places. , , form a partition of S.
, , , , .
Find .
A)
B)
C)
D)
E)
, , , , .
Find .
A)
B)
C)
D)
E)
Unlock Deck
Unlock for access to all 257 flashcards in this deck.
Unlock Deck
k this deck
23
Use Bayes' theorem or a tree diagram to calculate the indicated probability. Round the answer to four decimal places.
,
, form a partition of S.
, , , , .
Find .
A)
B)
C)
D)
E)
,
, form a partition of S.
, , , , .
Find .
A)
B)
C)
D)
E)
Unlock Deck
Unlock for access to all 257 flashcards in this deck.
Unlock Deck
k this deck
24
Tommy the Dunker's performance on the basketball court is influenced by his state of mind: If he scores, he is twice as likely to score on the next shot as he is to miss, whereas if he misses a shot, he is four times as likely to miss the next shot as he is to score. If Tommy has missed a shot, what is the probability that he will score two shots later
Unlock Deck
Unlock for access to all 257 flashcards in this deck.
Unlock Deck
k this deck
25
It snows in Greenland an average of once in 20 days, and when it does, glaciers have a 25% chance of growing. When it does not snow in Greenland, glaciers have only a 5% chance of growing. What is the probability that it is snowing in Greenland when glaciers are growing Please, round your answer to four decimal places.
A)0.1667
B) 0.8333
C) 0.2083
D) 0.3333
E) 0.7917
A)0.1667
B) 0.8333
C) 0.2083
D) 0.3333
E) 0.7917
Unlock Deck
Unlock for access to all 257 flashcards in this deck.
Unlock Deck
k this deck
26
You are given a transition matrix P. Find the steady-state distribution vector.
Unlock Deck
Unlock for access to all 257 flashcards in this deck.
Unlock Deck
k this deck
27
It rains in Spain an average of once in 10 days, and when it does, hurricanes have a 5% chance of happening in Hartford. When it does not rain in Spain, hurricanes have a 1% chance of happening in Hartford. What is the probability that it rains in Spain when hurricanes happen in Hartford Please, round your answer to four decimal places. ?
A)0.0397
B) 0.3571
C) 0.16
D) 0.3846
E) 0.06
A)0.0397
B) 0.3571
C) 0.16
D) 0.3846
E) 0.06
Unlock Deck
Unlock for access to all 257 flashcards in this deck.
Unlock Deck
k this deck
28
The following diagram shows the movement of U.S. households among three income groups - affluent, middle class, and poor - over the 11-year period 1982-1993.
? , , , ?
Use the transitions shown in the diagram to construct a transition matrix (assuming zero probabilities for the transitions between affluent and poor).
Take 1 = Affluent, 2 = Middle class, 3 = Poor.
Assuming that the trend shown was to continue, what percent of households classified as affluent in 1982 were predicted to become poor in 2004 (Give your answer to the nearest 0.1%.)
The answer is __________%
According to the model, what percentage of all U.S. households will be in each income bracket in the long term (Give your answers to the nearest 0.1 percent.)
Percent of affluent is __________%
Percent of middle class is __________%
Percent of poor is __________%
? , , , ?Use the transitions shown in the diagram to construct a transition matrix (assuming zero probabilities for the transitions between affluent and poor).
Take 1 = Affluent, 2 = Middle class, 3 = Poor.
Assuming that the trend shown was to continue, what percent of households classified as affluent in 1982 were predicted to become poor in 2004 (Give your answer to the nearest 0.1%.)
The answer is __________%
According to the model, what percentage of all U.S. households will be in each income bracket in the long term (Give your answers to the nearest 0.1 percent.)
Percent of affluent is __________%
Percent of middle class is __________%
Percent of poor is __________%
Unlock Deck
Unlock for access to all 257 flashcards in this deck.
Unlock Deck
k this deck
29
You are given a transition matrix P. Find the steady-state distribution vector.
Unlock Deck
Unlock for access to all 257 flashcards in this deck.
Unlock Deck
k this deck
30
Use Bayes' theorem or a tree diagram to calculate the indicated probability. Round the answer to four decimal places. , , form a partition of S.
, , , , .
Find .
A)
B)
C)
D)
E)
, , , , .
Find .
A)
B)
C)
D)
E)
Unlock Deck
Unlock for access to all 257 flashcards in this deck.
Unlock Deck
k this deck
31
You are given a transition matrix P. Find the steady-state distribution vector.
Unlock Deck
Unlock for access to all 257 flashcards in this deck.
Unlock Deck
k this deck
32
Write down the transition matrix associated with the given state transition diagram below.
, , ,
, , , Unlock Deck
Unlock for access to all 257 flashcards in this deck.
Unlock Deck
k this deck
33
The following diagram shows the movement of U.S. households among three income groups - affluent, middle class, and poor - over the 11-year period 1978-1989.
? , , , ?
Use the transitions shown in the diagram to construct a transition matrix (assuming zero probabilities for the transitions between affluent and poor).
Take 1 = Affluent, 2 = Middle class, 3 = Poor.
Assuming that the trend shown was to continue, what percent of households classified as affluent in 1978 were predicted to become poor in 2000 (Give your answer to the nearest 0.1%.)
The answer is __________%
According to the model, what percentage of all U.S. households will be in each income bracket in the long term (Give your answers to the nearest 0.1 percent.)
Percent of affluent is __________%
Percent of middle class is __________%
Percent of poor is __________%
? , , , ?Use the transitions shown in the diagram to construct a transition matrix (assuming zero probabilities for the transitions between affluent and poor).
Take 1 = Affluent, 2 = Middle class, 3 = Poor.
Assuming that the trend shown was to continue, what percent of households classified as affluent in 1978 were predicted to become poor in 2000 (Give your answer to the nearest 0.1%.)
The answer is __________%
According to the model, what percentage of all U.S. households will be in each income bracket in the long term (Give your answers to the nearest 0.1 percent.)
Percent of affluent is __________%
Percent of middle class is __________%
Percent of poor is __________%
Unlock Deck
Unlock for access to all 257 flashcards in this deck.
Unlock Deck
k this deck
34
Use Bayes' theorem or a tree diagram to calculate the indicated probability. Round the answer to four decimal places. , , . Find .
A)
B)
C)
D)
E)
A)
B)
C)
D)
E)
Unlock Deck
Unlock for access to all 257 flashcards in this deck.
Unlock Deck
k this deck
35
Any athlete who fails the Enormous State University's women's soccer fitness test is automatically dropped from the team. Last year, Mona Header failed the test, but claimed that this was due to the early hour. (The fitness test is traditionally given at 5 AM on a Sunday morning.) In fact, a study by the ESU Physical Education Department suggested that 50% of athletes fit enough to play on the team would fail the soccer test, although no unfit athlete could possibly pass the test. It also estimated that 41% of the athletes who take the test are fit enough to play soccer. Assuming these estimates are correct, what is the probability that Mona was justifiably dropped Please, round your answer to four decimal places.
A)0.205
B) 0.2579
C) 0.7421
D) 0.09
E) 0.2217
A)0.205
B) 0.2579
C) 0.7421
D) 0.09
E) 0.2217
Unlock Deck
Unlock for access to all 257 flashcards in this deck.
Unlock Deck
k this deck
36
Write down the transition matrix associated with the state transition diagram.
Unlock Deck
Unlock for access to all 257 flashcards in this deck.
Unlock Deck
k this deck
37
A University of Montana study shows the following one-generation transition probabilities among four major income groups. In the long term, what percentage of male earners would you expect to find in each category Round your answers to two decimal places. ?
Bottom 10%: __________%
10-50%: __________%
50-90%: __________%
Top 10%: __________%
?
50-90%
50-90%
Bottom 10%: __________%
10-50%: __________%
50-90%: __________%
Top 10%: __________%
?
50-90%
50-90%
Unlock Deck
Unlock for access to all 257 flashcards in this deck.
Unlock Deck
k this deck
38
In 2001, 37.4% of all light vehicles were cars, and the rest were pickups or SUVs. The probability that a severe side-impact crash would prove deadly to a driver depended on the type of vehicle he or she was driving at the time, as shown in the table. What is the probability that the victim of a deadly side-impact accident was driving a car Please, round your answer to two decimal places.
A)0.67
B) 0.33
C) 0.37
D) 0.17
E) 0.77
A)0.67
B) 0.33
C) 0.37
D) 0.17
E) 0.77
Unlock Deck
Unlock for access to all 257 flashcards in this deck.
Unlock Deck
k this deck
39
Write down the transition matrix associated with the given state transition diagram.
, , , , ,
, , , , , Unlock Deck
Unlock for access to all 257 flashcards in this deck.
Unlock Deck
k this deck
40
Write down the transition matrix associated with the given state transition diagram below.
, , ,
, , , Unlock Deck
Unlock for access to all 257 flashcards in this deck.
Unlock Deck
k this deck
41
According to a study in The New England Journal of Medicine, 202 of a sample of 5,990 middle-aged men had developed diabetes. It also found that men who were very active (burning about 3,500 calories daily) were half as likely to develop diabetes compared with men who were sedentary. Assume that one-fourth of all middle-aged men are very active, and the rest are classified as sedentary. What is the probability that a middle-aged man with diabetes is very active Please, round your answer to two decimal places.
A)0.14
B) 0.57
C) 0.86
D) 0.11
E) 0.25
A)0.14
B) 0.57
C) 0.86
D) 0.11
E) 0.25
Unlock Deck
Unlock for access to all 257 flashcards in this deck.
Unlock Deck
k this deck
42
Professor Frank Nabarro insists that all senior physics majors take his notorious physics aptitude test. The test is so tough that anyone not going on to a career in physics has no hope of passing, whereas 60% of the seniors who do go on to a career in physics still fail the test. Further, 76% of all senior physics majors in fact go on to a career in physics. Assuming that you fail the test, what is the probability that you will not go on to a career in physics Please, round your answer to two decimal places.
A)0.16
B) 0.34
C) 0.71
D) 0.66
E) 0.46
A)0.16
B) 0.34
C) 0.71
D) 0.66
E) 0.46
Unlock Deck
Unlock for access to all 257 flashcards in this deck.
Unlock Deck
k this deck
43
According to a study conducted by the Harvard School of Public Health, a driver who was wearing a seatbelt was 31% more likely to be killed in an accident if the car had an air bag that deployed than if it did not. Airbags deployed in 25% of all accidents. For a driver wearing a seatbelt, what is the probability that the airbag deployed in an accident in which the driver was killed (Round your answer to two decimal places.)
A)0.73
B) 0.27
C) 0.30
D) 0.08
E) 0.70
A)0.73
B) 0.27
C) 0.30
D) 0.08
E) 0.70
Unlock Deck
Unlock for access to all 257 flashcards in this deck.
Unlock Deck
k this deck
44
Concerning Internet use In 1998, 59% of all Caucasians in the U.S., 50% of all African-Americans, 58% of all Hispanics, and 54% of residents not classified into one of these groups used the Internet to search for information. At that time, the U.S. population was 69% Caucasian, 12% African-American, and 13% Hispanic. What percentage of U.S. residents who used the Internet for information search were African-American Express your answer to the nearest 1%.
The answer is __________%
The answer is __________%
Unlock Deck
Unlock for access to all 257 flashcards in this deck.
Unlock Deck
k this deck
45
Use Bayes' theorem or a tree diagram to calculate the indicated probability. Round the answer to four decimal places.
, , form a partition of S.
, , , , .
Find .
__________
, , form a partition of S.
, , , , .
Find
.
__________ Unlock Deck
Unlock for access to all 257 flashcards in this deck.
Unlock Deck
k this deck
46
In 2003, 43.8% of all light vehicles were cars, 28.1% were pickups, and 28.1% were SUVs. The probability that a severe side-impact crash would prove deadly to a driver depended on the type of vehicle he or she was driving at the time, as shown in the table. What is the probability that the victim of a deadly side-impact accident was driving an SUV Please, round your answer to three decimal places, if necessary.
A)0.235
B) 0.827
C) 0.28
D) 0.173
E) 0.276
A)0.235
B) 0.827
C) 0.28
D) 0.173
E) 0.276
Unlock Deck
Unlock for access to all 257 flashcards in this deck.
Unlock Deck
k this deck
47
Concerning Internet use In 1999, 59% of all Caucasians in the U.S., 60% of all African-Americans, 58% of all Hispanics, and 54% of residents not classified into one of these groups used the Internet to search for information. At that time, the U.S. population was 69% Caucasian, 12% African-American, and 13% Hispanic. What percentage of U.S. residents who used the Internet for information search were African-American Express your answer to the nearest 1%.
A)22%
B) 15%
C) 87%
D) 20%
E) 13%
A)22%
B) 15%
C) 87%
D) 20%
E) 13%
Unlock Deck
Unlock for access to all 257 flashcards in this deck.
Unlock Deck
k this deck
48
Two of the mathematics professors at Enormous State are Professor A (known for easy grading) and Professor F (known for tough grading). Last semester, roughly half of Professor F's class consisted of former students of Professor A; these students apparently felt encouraged by their (utterly undeserved) high grades. (Professor F's own former students had fled in droves to Professor A's class to try to shore up their grade point averages.) At the end of the semester, as might have been predicted, all of Professor A's former students wound up with a C- or lower. The rest of the students in the class--former students of Professor F who had decided to "stick it out"-fared better, and three quarters of them earned higher than a C-. After discovering what had befallen them, all the students who earned C- or lower got together and decided to send a delegation to the Department Chair to complain that their grade point averages had been ruined by this callous and heartless beast! The contingent was to consist of 20 representatives selected at random from among them. How many of the 20 would you estimate to have been former students of Professor A ?
A)4
B) 17
C) 15
D) 10
E) 16
A)4
B) 17
C) 15
D) 10
E) 16
Unlock Deck
Unlock for access to all 257 flashcards in this deck.
Unlock Deck
k this deck
49
In fall 2003, UCLA admitted 24% of its California resident applicants, 22% of its applicants from other U.S. states, and 18% of its international student applicants. Of all its applicants, 87% were California residents, 9% were from other U.S. states, and 4% were international students. What percentage of all admitted students were California residents (Round your answer to the nearest 1%.)
The probability is __________%
The probability is __________%
Unlock Deck
Unlock for access to all 257 flashcards in this deck.
Unlock Deck
k this deck
50
In 2000, 86% of all Caucasians in the U.S., 77% of all African-Americans, 77% of all Hispanics, and 85% of residents not classified into one of these groups used the Internet for e-mail. At that time, the U.S. population was 69% Caucasian, 12% African-American, and 13% Hispanic. What percentage of U.S. residents who used the Internet for e-mail were Hispanic Express your answer to the nearest 1%.
The answer is __________%
The answer is __________%
Unlock Deck
Unlock for access to all 257 flashcards in this deck.
Unlock Deck
k this deck
51
A New York Times survey of needy and disabled youths showed that 51% of those who had no preschool education were arrested or charged with a crime by the time they were 19, whereas only 31% who had preschool education wound up in this category. The survey did not specify what percentage of the youths in the survey had preschool education, so let us take a guess at that and estimate that 75% of them had attended preschool. Would youths who had preschool education be more likely to be arrested or charged with a crime than those who did not ?
A)No
B) The probabilities are equal
C) Yes
A)No
B) The probabilities are equal
C) Yes
Unlock Deck
Unlock for access to all 257 flashcards in this deck.
Unlock Deck
k this deck
52
In fall 2003, UCLA admitted 24% of its California resident applicants, 22% of its applicants from other U.S. states, and 18% of its international student applicants. Of all its applicants, 87% were California residents, 9% were from other U.S. states, and 4% were international students. What percentage of all admitted students were California residents (Round your answer to the nearest 1%.) ?
A)89%
B) 87%
C) 85%
D) 80%
E) 20%
A)89%
B) 87%
C) 85%
D) 80%
E) 20%
Unlock Deck
Unlock for access to all 257 flashcards in this deck.
Unlock Deck
k this deck
53
According to a study in The New England Journal of Medicine, 85 of a sample of 5,990 middle-aged men had developed heart disease. It also found that men who were very active (burning about 3,500 calories daily) were half as likely to develop heart disease compared with men who were sedentary. Assume that one in nine middle-aged men are very active, and the rest are classified as sedentary. What is the probability that a middle-aged man with heart disease is very active Please, round your answer to three decimal places.
A)0.941
B) 0.111
C) 0.059
D) 0.529
E) 0.053
A)0.941
B) 0.111
C) 0.059
D) 0.529
E) 0.053
Unlock Deck
Unlock for access to all 257 flashcards in this deck.
Unlock Deck
k this deck
54
Use Bayes' theorem or a tree diagram to calculate the indicated probability. Round the answer to four decimal places.
, , form a partition of S.
, , , , .
Find .
__________
, , form a partition of S.
, , , , .
Find
.
__________ Unlock Deck
Unlock for access to all 257 flashcards in this deck.
Unlock Deck
k this deck
55
A local TV station employs Desmorelda, "Mistress of the Zodiac", as its weather forecaster. Now, when it rains, Sagittarius is in the shadow of Jupiter one-fourth of the time, and it rains on 5 out of every 50 days. Sagittarius falls in Jupiter's shadow on only one in every six rainless days. The powers that be at the station notice a disturbing pattern to Desmorelda's weather predictions. It seems that she always predicts that it will rain when Sagittarius is in the shadow of Jupiter. What percentage of the time is she correct Round your answer to the nearest 1%.
A)18%
B) 14%
C) 13%
D) 15%
E) 10%
A)18%
B) 14%
C) 13%
D) 15%
E) 10%
Unlock Deck
Unlock for access to all 257 flashcards in this deck.
Unlock Deck
k this deck
56
According to a study conducted by the Harvard School of Public Health, a driver who was not wearing a seatbelt was 84% more likely to be killed in an accident if the car had an air bag that deployed than if it did not. Airbags deployed in 25% of all accidents. For a driver not wearing a seatbelt, what is the probability that the airbag deployed in an accident in which the driver was killed
A)0.21
B) 0.38
C) 0.62
D) 0.72
E) 0.28
A)0.21
B) 0.38
C) 0.62
D) 0.72
E) 0.28
Unlock Deck
Unlock for access to all 257 flashcards in this deck.
Unlock Deck
k this deck
57
In 1998, 86% of all Caucasians in the U.S., 77% of all African-Americans, 70% of all Hispanics, and 85% of residents not classified into one of these groups used the Internet for e-mail. At that time, the U.S. population was 69% Caucasian, 12% African-American, and 13% Hispanic. What percentage of U.S. residents who used the Internet for e-mail were Hispanic Round your answer to the nearest 1%.
A)22%
B) 89%
C) 19%
D) 11%
E) 12%
A)22%
B) 89%
C) 19%
D) 11%
E) 12%
Unlock Deck
Unlock for access to all 257 flashcards in this deck.
Unlock Deck
k this deck
58
Use Bayes' theorem or a tree diagram to calculate the indicated probability. Round the answer to four decimal places.
, , form a partition of S.
, , , , .
Find .
__________
, , form a partition of S.
, , , , .
Find
.
__________ Unlock Deck
Unlock for access to all 257 flashcards in this deck.
Unlock Deck
k this deck
59
Use Bayes' Theorem to calculate when , , . Please round the answer to three decimal places.
__________
when , , . Please round the answer to three decimal places.
__________ Unlock Deck
Unlock for access to all 257 flashcards in this deck.
Unlock Deck
k this deck
60
Two of the mathematics professors at Enormous State are Professor A (known for easy grading) and Professor F (known for tough grading). Last semester, roughly half of Professor F's class consisted of former students of Professor A; these students apparently felt encouraged by their (utterly undeserved) high grades. (Professor F's own former students had fled in droves to Professor A's class to try to shore up their grade point averages.) At the end of the semester, as might have been predicted, all of Professor A's former students wound up with a C- or lower. The rest of the students in the class--former students of Professor F who had decided to "stick it out"-fared better, and three quarters of them earned higher than a C-. After discovering what had befallen them, all the students who earned C- or lower got together and decided to send a delegation to the Department Chair to complain that their grade point averages had been ruined by this callous and heartless beast! The contingent was to consist of 10 representatives selected at random from among them. How many of the 10 would you estimate to have been former students of Professor A
The answer is __________.
The answer is __________.
Unlock Deck
Unlock for access to all 257 flashcards in this deck.
Unlock Deck
k this deck
61
A local TV station employs Desmorelda, "Mistress of the Zodiac", as its weather forecaster. Now, when it rains, Sagittarius is in the shadow of Jupiter one-fourth of the time, and it rains on 4 out of every 50 days. Sagittarius falls in Jupiter's shadow on only one in every six rainless days. The powers that be at the station notice a disturbing pattern to Desmorelda's weather predictions. It seems that she always predicts that it will rain when Sagittarius is in the shadow of Jupiter. What percentage of the time is she correct Round your answer to the nearest 1%.
The percentage is __________%.
The percentage is __________%.
Unlock Deck
Unlock for access to all 257 flashcards in this deck.
Unlock Deck
k this deck
62
Professor Frank Nabarro insists that all senior physics majors take his notorious physics aptitude test. The test is so tough that anyone not going on to a career in physics has no hope of passing, whereas 60% of the seniors who do go on to a career in physics still fail the test. Further, 76% of all senior physics majors in fact go on to a career in physics. Assuming that you fail the test, what is the probability that you will not go on to a career in physics Please, round your answer to two decimal places.
The probability is __________.
The probability is __________.
Unlock Deck
Unlock for access to all 257 flashcards in this deck.
Unlock Deck
k this deck
63
It snows in Greenland an average of once in 25 days, and when it does, glaciers have a 15% chance of growing. When it does not snow in Greenland, glaciers have only a 4% chance of growing. What is the probability that it is snowing in Greenland when glaciers are growing Please, round your answer to four decimal places.
The probability is __________.
The probability is __________.
Unlock Deck
Unlock for access to all 257 flashcards in this deck.
Unlock Deck
k this deck
64
The following table shows hypothetical U.S. employment figures, broken down by educational attainment. All numbers are in millions and represent civilians aged 16 years and over. Those classed as "Not in Labor Force" were not employed nor actively seeking employment. Find the probability that a person was employed given that the person has less than 4 years of high school. Please round the answer to two decimal places.
A)0.49
B) 0.48
C) 0.53
D) 0.52
E) 0.51
A)0.49
B) 0.48
C) 0.53
D) 0.52
E) 0.51
Unlock Deck
Unlock for access to all 257 flashcards in this deck.
Unlock Deck
k this deck
65
Determine whether the given events A and B are independent, mutually exclusive, or neither.
A: Your new skateboard design is a success.
B: There is life in the Andromeda Galaxy.
A)neither
B) independent
C) mutually exclusive
A: Your new skateboard design is a success.
B: There is life in the Andromeda Galaxy.
A)neither
B) independent
C) mutually exclusive
Unlock Deck
Unlock for access to all 257 flashcards in this deck.
Unlock Deck
k this deck
66
According to a study conducted by the Harvard School of Public Health, a driver who was wearing a seatbelt was 31% more likely to be killed in an accident if the car had an air bag that deployed than if it did not. Airbags deployed in 25% of all accidents. For a driver wearing a seatbelt, what is the probability that the airbag deployed in an accident in which the driver was killed (Round your answer to two decimal places.)
The probability is __________.
The probability is __________.
Unlock Deck
Unlock for access to all 257 flashcards in this deck.
Unlock Deck
k this deck
67
A bag contains 3 red marbles, 2 green ones, 1 fluorescent pink one, 2 yellow ones, and 2 orange ones. Suzy grabs 4 at random. Find the probability of the event: "She gets all the red ones, given that she gets the yellow one."
A)
B)
C)
D)
E)
A)
B)
C)
D)
E)
Unlock Deck
Unlock for access to all 257 flashcards in this deck.
Unlock Deck
k this deck
68
According to a study conducted by the Harvard School of Public Health, a child seated in the front seat who was not wearing a seatbelt was 84% more likely to be killed in an accident if the car had an air bag that deployed than if it did not. Airbags deployed in 25% of all accidents. For a child seated in the front seat not wearing a seatbelt, what is the probability that the airbag deployed in an accident in which the child was killed (Round your answer to two decimal places.)
The probability is __________.
The probability is __________.
Unlock Deck
Unlock for access to all 257 flashcards in this deck.
Unlock Deck
k this deck
69
It rains in Spain an average of once in 20 days, and when it does, hurricanes have a 4% chance of happening in Hartford. When it does not rain in Spain, hurricanes have a 1% chance of happening in Hartford. What is the probability that it rains in Spain when hurricanes happen in Hartford Please, round your answer to four decimal places.
The probability is __________.
The probability is __________.
Unlock Deck
Unlock for access to all 257 flashcards in this deck.
Unlock Deck
k this deck
70
According to a study The New England Journal of Medicine, 202 of a sample of 5,940 middle-aged men had developed heart disease. It also found that men who were very active (burning about 3,500 calories daily) were half as likely to develop heart disease compared with men who were sedentary. Assume that one in nine middle-aged man is very active, and the rest are classified as sedentary. What is the probability that a middle-aged man with heart disease is very active Please, round your answer to three decimal places.
The probability is __________.
The probability is __________.
Unlock Deck
Unlock for access to all 257 flashcards in this deck.
Unlock Deck
k this deck
71
Find the conditional probability of the event "The red one is 5, given that the sum is 7" when two fair dice (one red and one green) are rolled.
A)
B)
C)
D)
E)
A)
B)
C)
D)
E)
Unlock Deck
Unlock for access to all 257 flashcards in this deck.
Unlock Deck
k this deck
72
Find the conditional probability of the event "The sum is 5, given that the green one is either 2 or 3" when two fair dice (one red and one green) are rolled.
A)
B)
C)
D)
E)
A)
B)
C)
D)
E)
Unlock Deck
Unlock for access to all 257 flashcards in this deck.
Unlock Deck
k this deck
73
The following table shows hypothetical U.S. employment figures, broken down by educational attainment. All numbers are in millions and represent civilians aged 16 years and over. Those classed as "Not in Labor Force" were not employed nor actively seeking employment. Find the probability that a person was employed given that the person has more than 4 years of high school. Please round the answer to two decimal places.
A)0.76
B) 0.96
C) 0.97
D) 0.77
E) 0.75
A)0.76
B) 0.96
C) 0.97
D) 0.77
E) 0.75
Unlock Deck
Unlock for access to all 257 flashcards in this deck.
Unlock Deck
k this deck
74
Any athlete who fails the Enormous State University's women's soccer fitness test is automatically dropped from the team. Last year, Mona Header failed the test, but claimed that this was due to the early hour. (The fitness test is traditionally given at 5 AM on a Sunday morning.) In fact, a study by the ESU Physical Education Department suggested that 50% of athletes fit enough to play on the team would fail the soccer test, although no unfit athlete could possibly pass the test. It also estimated that 41% of the athletes who take the test are fit enough to play soccer. Assuming these estimates are correct, what is the probability that Mona was justifiably dropped Please, round your answer to four decimal places.
The probability is __________.
The probability is __________.
Unlock Deck
Unlock for access to all 257 flashcards in this deck.
Unlock Deck
k this deck
75
New York Times survey of needy and disabled youths showed that 51% of those who had no preschool education were arrested or charged with a crime by the time they were 19, whereas only 31% who had preschool education wound up in this category. The survey did not specify what percentage of the youths in the survey had preschool education, so let us take a guess at that and estimate that 25% of them had attended preschool.
What percentage of the youths arrested or charged with a crime had no preschool education Round your answer to the nearest 0.01%.
The answer is __________%
What would this figure be if 75% of the youths had attended preschool Round your answer to the nearest 0.01%.
The answer is __________%
Would youths who had preschool education be more likely to be arrested or charged with a crime than those who did not
Unlock Deck
Unlock for access to all 257 flashcards in this deck.
Unlock Deck
k this deck
76
Compute the following quantities. , , , and
A) , , , and
B) , , , and
C) , , , and
D) , , , and
E) , , , and
A) , , , and
B) , , , and
C) , , , and
D) , , , and
E) , , , and
Unlock Deck
Unlock for access to all 257 flashcards in this deck.
Unlock Deck
k this deck
77
According to a study in The New England Journal of Medicine, 85 of a sample of 5,990 middle-aged men had developed heart disease. It also found that men who were very active (burning about 3,500 calories daily) were half as likely to develop heart disease compared with men who were sedentary. Assume that one-fourth of all middle-aged men are very active, and the rest are classified as sedentary. What is the probability that a middle-aged man with heart disease is very active Please, round your answer to two decimal places.
?
The probability is __________.
?
The probability is __________.
Unlock Deck
Unlock for access to all 257 flashcards in this deck.
Unlock Deck
k this deck
78
In 2004, 45.4% of all light vehicles were cars, 27.3% were pickups, and 27.3% were SUVs. The probability that a severe side-impact crash would prove deadly to a driver depended on the type of vehicle he or she was driving at the time, as shown in the table. What is the probability that the victim of a deadly side-impact accident was driving an SUV Please, round your answer to four decimal places.
The probability is __________.
The probability is __________.
Unlock Deck
Unlock for access to all 257 flashcards in this deck.
Unlock Deck
k this deck
79
In 2002, 39.8% of all light vehicles were cars, and the rest were pickups or SUVs. The probability that a severe side-impact crash would prove deadly to a driver depended on the type of vehicle he or she was driving at the time, as shown in the table. What is the probability that the victim of a deadly side-impact accident was driving a car Please, round your answer to two decimal places.
The probability is __________.
The probability is __________.
Unlock Deck
Unlock for access to all 257 flashcards in this deck.
Unlock Deck
k this deck
80
A bag contains 4 red marbles, 3 green ones, 1 fluorescent pink one, 2 yellow ones, and 2 orange ones. Suzy grabs 4 at random. Find the probability of the event: "She gets one of each color other than fluorescent pink, given that she gets the fluorescent pink one."
A)
B)
C)
D)
E)
A)
B)
C)
D)
E)
Unlock Deck
Unlock for access to all 257 flashcards in this deck.
Unlock Deck
k this deck
Unlock Deck
Unlock for access to all 257 flashcards in this deck.


