Deck 14: Monte Carlo Simulation
Full screen (f)
Question
Question
Question
Question
Question
Which of the following inferences about a variable of interest can be drawn from the graph given below? 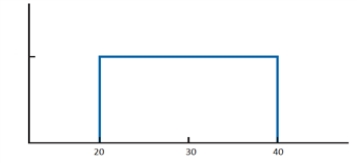
A)The variable is equally likely to take any value between 20 and 40.
B)The variable is more likely to take the value 20 than 40.
C)The variable is more likely to take any value outside the range of 20 and 40.
D)The variable can only take the value 30.
A)The variable is equally likely to take any value between 20 and 40.
B)The variable is more likely to take the value 20 than 40.
C)The variable is more likely to take any value outside the range of 20 and 40.
D)The variable can only take the value 30.
Question
In reviewing the graph below, which of the following inferences can be drawn about the monthly salary? 
A)The average monthly salary is $3000.
B)The monthly salary is always less than $3000.
C)The monthly salary is always greater than $3000.
D)The range of the monthly salary distribution is $3000 to $5000.
A)The average monthly salary is $3000.
B)The monthly salary is always less than $3000.
C)The monthly salary is always greater than $3000.
D)The range of the monthly salary distribution is $3000 to $5000.
Question
Question
Question
Question
Question
Question
Question
The type of distribution shown in the graph below is 
A)uniform.
B)normal.
C)exponential.
D)beta.
A)uniform.
B)normal.
C)exponential.
D)beta.
Question
Question
Question
Question
Question
Question
Question
Question
Question
Question
Question
Question
Question
Question
Question
Question
Question
Question
Question
Question
Question
Question
Question
Question
Question
Question
Question
Question
A store is offering a discount on 800 pairs of basketball shoes. The amount of the discount varies and is not revealed to the customer until checkout. The distribution of discounts is given in the below table. 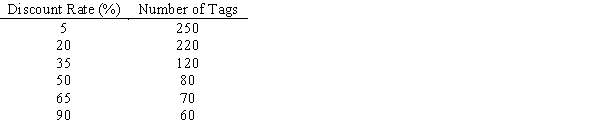 Use the negative binomial distribution to approximate the average number of pairs of shoes that a customer has to buy before purchasing two pair with a discount of at least 50%.
Use the negative binomial distribution to approximate the average number of pairs of shoes that a customer has to buy before purchasing two pair with a discount of at least 50%. Question
Salemach Corporation is a start-up company that manufactures simple machines. It is interested in analyzing the profit from a new machine. It estimates that the selling price will be $150 per unit and the setup and advertising costs will total $250,000. The company estimates that the per unit raw material cost is uniformly distributed between $50 and $80 and are equally likely. The demand is normally distributed with a mean of 12,000 units and a standard deviation of 3000 units. The probability distribution for a range of labor cost per unit is given below. 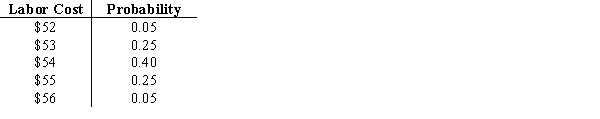
a. Obtain estimates for the mean profit, maximum profit, minimum profit, and standard deviation of profit.
b. What is your estimate of the probability of a loss?
a. Obtain estimates for the mean profit, maximum profit, minimum profit, and standard deviation of profit.
b. What is your estimate of the probability of a loss?
Question
The quality of a device should be examined in the inspection department sequentially in three steps before it is sent to packaging department. The probability distributions for the time required to complete each of the activities are as follows:
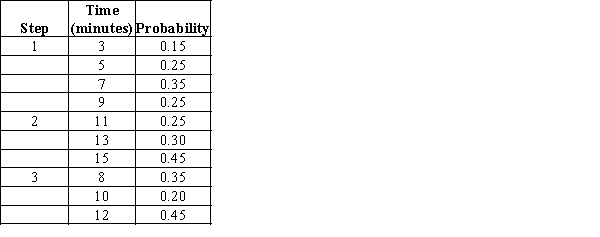
a. Construct a spreadsheet simulation model to estimate the average time spent in inspection department and the standard deviation of the time spent in inspection department.
b. What is the estimated probability that the inspection will be completed in 32 minutes or less?
a. Construct a spreadsheet simulation model to estimate the average time spent in inspection department and the standard deviation of the time spent in inspection department.
b. What is the estimated probability that the inspection will be completed in 32 minutes or less?
Question
The stock price of Robin Tires, Inc., listed on the Stock Exchange is currently $20. The following probability distribution shows how the price per share is expected to change over a three-month period:
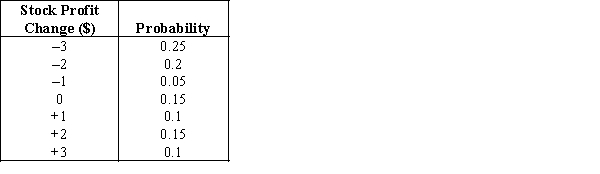
a. Construct a spreadsheet simulation model that computes the value of the stock profit in 3 months, 6 months, 9 months, and 12 months under the assumption that the change in profit over any 3-month period is independent of the change in profit over any other 3-month period.
b. With the current profit of $20 per share, simulate the profit per share for the next four 3-month periods. What is the average profit in 12 months? What is the standard deviation of the profit in 12 months?
Question
Question
Consider the table below with information regarding each activity, immediate predecessors, and duration estimates (in minutes) for each activity. 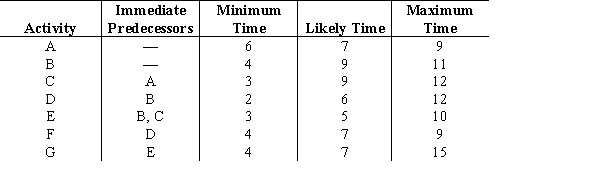
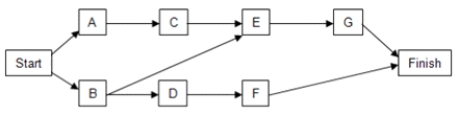
a. Using the PERT distribution in ASP to represent the duration of each activity, construct a simulation model to compute the total time to complete the task.
b. What is the expected duration of the entire project? What is the standard deviation of the project duration?
c. What is the likelihood that the project will be complete in 26 minutes?
Question
A specialty hedge fund is considering the purchase of a Jackson Pollock painting. It estimates the value of the painting to be $185 million. In an auction, both the number of competing bids and the amount of the competing bids is uncertain. The hedge fund has maintained a file summarizing 10 recent art auctions that it believes are similar to the upcoming auction. It is considering a bid of $163 million and would like to evaluate its chances of winning the upcoming auction with this bid. 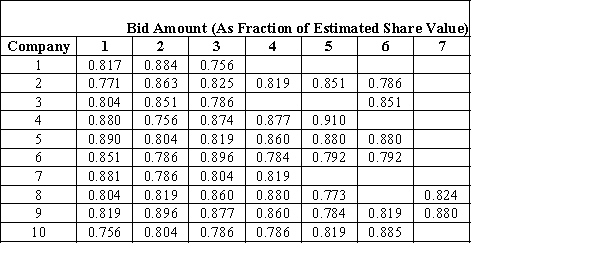
a. Construct a spreadsheet simulation model for this auction. Use a discrete uniform distribution between the minimum and maximum number of bidders in the 10 observed auctions to model the number of bidders in the Jackson Pollock auction. Fit a realistic distribution to the bid data to generate values of competing bid amounts. Use ASP to apply simulation optimization to determine the hedge fund's bid amount that maximizes the expected return = P(winning auction)*(185 - bid amount). Hint: Placing reasonable bounds on the highest and lowest possible bid amount will greatly assist the optimization algorithm.
b. What is the probability that the hedge fund wins the auction if it bids the amount that maximizes its expected return?
Question
Question
The manager of a company decides to arrange a party for being promoted and has invited 50 guests for dinner. The following table contains information on the number of RSVP'ed guests. He assumes that 12 people will not turn up. He also estimates that 13 guests planning to come solo has a 65 percent chance of attending alone, a 30 percent chance of not attending, and a 5 percent chance of bringing a companion. For each of the 20 guests who plan to bring a companion, there is a 75 percent chance that she or he will attend with a companion, a 10 percent chance of attending solo, and a 15 percent chance of not attending at all. For the 5 people who have not responded, the wedding planner assumes that there is an 85 percent chance that each will not attend, a 10 percent chance they will attend alone, and a 5 percent chance they will attend with a companion.
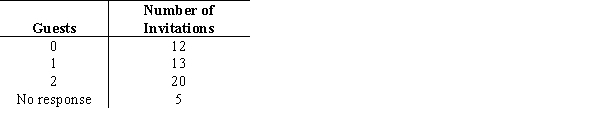
a. Assist the manager by constructing a spreadsheet simulation model to determine the expected number of guests who will attend the party.
b. Use the Monte Carlo simulation model to determine X, the minimum number of guests for whom the dinner needs to be ordered, so that there is at least a 95 percent chance that the actual attendance is less than or equal to X. What is the best estimate for the value of X?
Question
A football tournament is conducted between Team-A and Team-B of a college and the winner being the first team to win four games of seven games. The probability that Team-A wins each game are as follows: 
a. Set up a spreadsheet simulation model in which whether Team-A wins each game is a random variable.
b. What is the probability that the Team- A win the tournament?
c. What is the average number of games played regardless of winner?
a. Set up a spreadsheet simulation model in which whether Team-A wins each game is a random variable.
b. What is the probability that the Team- A win the tournament?
c. What is the average number of games played regardless of winner?
Question
An entrepreneur who operates a cellular phone store orders inventory of cell phones based on four internal memory specifications - 8 GB, 16 GB, 32 GB, and 64 GB. She wants to evaluate her inventory ordering policy for the phones with four different amounts of internal memory. Any phone unsold at the end of a period is kept in inventory for the next sales period and incurs a holding cost expressed as 10% of the cost per unit per period. If demand during a period exceeds supply for a phone, then sale is lost. The data on the cost and selling prices of the cell phones categorized by these memory specifications are known, and representative data on the past sales are also available. 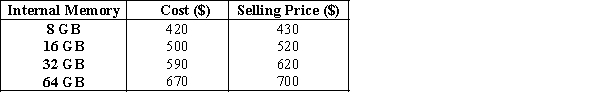 Past Sales:
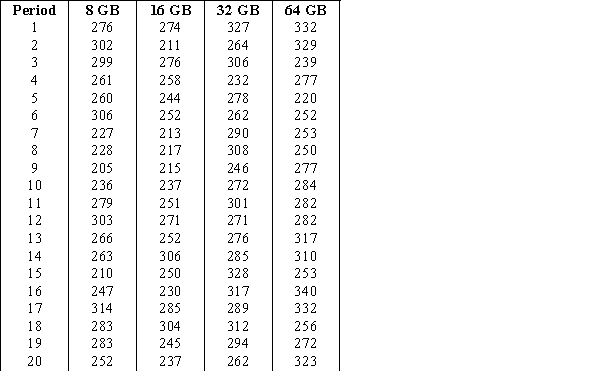
a. Construct a spreadsheet simulation model to estimate the total profit the entrepreneur earns in a period when ordering 300 units of each cell phone. To model the respective cell phone demands, fit a realistic distribution to the sales data. What is the average total profit? What is the estimated likelihood that the entrepreneur makes less than $10,000 next period?
b. Using Spearman rank correlation, compute the correlations between the demands for the cells phones based on the four memory specifications. Incorporate a correlation matrix to captures the interrelationships between the demands for each cell phone type. What is the average total profit? What is the estimated likelihood that the entrepreneur makes less than $10,000 next period? Comparing these answers to (a), conclude how the correlated demand affects the model's implications.
Past Sales: a. Construct a spreadsheet simulation model to estimate the total profit the entrepreneur earns in a period when ordering 300 units of each cell phone. To model the respective cell phone demands, fit a realistic distribution to the sales data. What is the average total profit? What is the estimated likelihood that the entrepreneur makes less than $10,000 next period?
b. Using Spearman rank correlation, compute the correlations between the demands for the cells phones based on the four memory specifications. Incorporate a correlation matrix to captures the interrelationships between the demands for each cell phone type. What is the average total profit? What is the estimated likelihood that the entrepreneur makes less than $10,000 next period? Comparing these answers to (a), conclude how the correlated demand affects the model's implications.
Question
Question
Question
Team X is scheduled to play against Team Y in an upcoming game in Baseball's World Series. Assume that each player's point production can be represented as an integer uniform variable with the ranges provided in the following table:
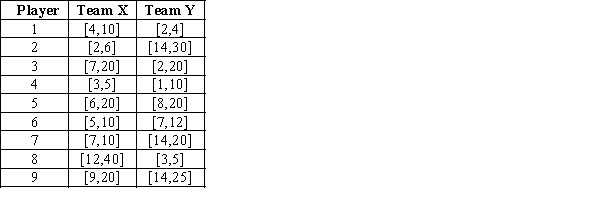
a. Develop a spreadsheet model that simulates the points scored by each team.
b. What are the average and standard deviation of points scored by Team X? What is the shape of the distribution of points scored by Team X?
c. What are the average and standard deviation of points scored by Team Y? What is the shape of the distribution of points scored by Team Y?
d. Let Point Differential = Team X points - Team Y points. What is the average point differential between the two teams? What is the standard deviation in the point differential? What is the shape of the point differential distribution?
e. What is the probability that the Team X scores more points than the Team Y?
Question
A specialty hedge fund is considering the purchase of a Jackson Pollock painting. It estimates the value of the painting to be $185 million. In an auction, both the number of competing bids and the amount of the competing bids is uncertain. The hedge fund has maintained a file summarizing 10 recent art auctions that it believes are similar to the upcoming auction. It is considering a bid of $163 million and would like to evaluate its chances of winning the upcoming auction with this bid. 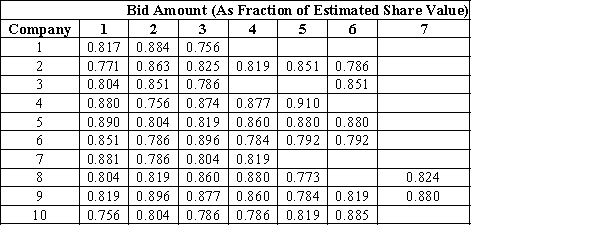
a. Construct a spreadsheet simulation model to determine the likelihood of the hedge fund winning the auction. Use a discrete uniform distribution between the minimum and maximum number of bidders in the 10 observed auctions to model the number of bidders in the Jackson Pollock auction. Fit a realistic distribution to the bid data to generate values of competing bid amounts.
b. For a bid amount of $163 million, estimate the probability of the hedge fund winning the auction?
Question
A store is offering a discount on 800 pairs of basketball shoes. The amount of the discount varies and is not revealed to the customer until checkout. The distribution of discounts is given in the below table.  How many pairs of shoes does a customer have to buy so that, on average, he has purchased five containing a 65% or 90% discount? (Hint: Use the hypergeometric distribution in ASP to answer this question.)
How many pairs of shoes does a customer have to buy so that, on average, he has purchased five containing a 65% or 90% discount? (Hint: Use the hypergeometric distribution in ASP to answer this question.) Question
Sunseel Industries produces different types of raw materials and it is interested in using simulation to estimate the profit per unit for its new product X. The selling price for the product will be $40 per unit. Probability distributions for the raw material cost, the production cost, and the marketing cost are estimated as follows. 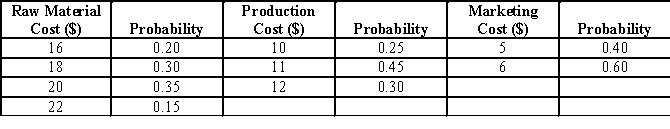
a. Compute profit per unit for the base case, worst case, and best case.
b. Construct a simulation model to estimate the mean profit per unit.
c. Management believes the project may not be sustainable if the profit per unit is less than $2. Use simulation to estimate the probability the profit per unit will be less than $2.
Question
A distributor has generated a rough estimate of aftershave demand at their retails store. The distributor is confident that demand will range from 100 to 650. The following table lists weights for demand values within this range.

The distributor pays a wholesale price of $21 per aftershave and then sells at a retail price of $31.
a. Construct a spreadsheet model that computes net profit corresponding to a given level of demand and specified order quantity. Model demand as a random variable with ASP's custom general distribution.
b. Using simulation optimization, determine the order quantity that maximizes expected profit. What is the probability of running out of aftershave at this order quantity?
c. How many aftershaves does the distributor need to order so that the probability of running out of aftershaves is only 25 percent? How much expected profit will the distributor lose if he orders this amount rather than the amount from part b?
Question
A tourist bus can accommodate 80 people and currently books up to 80 reservations. Past data shows that the tourist bus always accommodates all 80 reservations but that, on average, two people do not show up. To capture additional profit, the travel agent is considering an overbooking strategy in which he would accept 82 reservations even though the tourist bus can accommodate only 80 people. The travel agent believes that he will be able to always book all 82 reservations. The probability distribution for the number of people showing up when 82 reservations are accepted is estimated as follows:
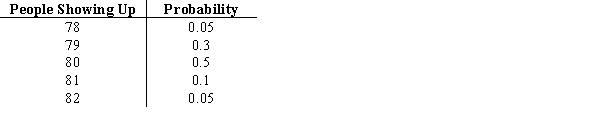
The travel agent receives a marginal profit of $110 for each passenger who books a reservation (regardless whether they show up). The travel agent will also incur a cost for any passenger denied seating on the bus. This cost covers added expenses of rescheduling the passenger as well as loss of goodwill, estimated to be $160 per passenger. Develop a spreadsheet simulation model for this overbooking system. Simulate the number of passengers showing up.
a. What is the average net profit for each tourist bus with the overbooking strategy?
b. What is the probability that the net profit with the overbooking strategy will be less than the net profit without overbooking (80 × $110 = $8,800)?
c. Explain how your simulation model could be used to evaluate other overbooking levels such as 81, 83, and 84 and for recommending a best overbooking strategy.

Unlock Deck
Sign up to unlock the cards in this deck!
Unlock Deck
Unlock Deck
1/59
Play
Full screen (f)
Deck 14: Monte Carlo Simulation
1
The range of computer-generated random numbers is
A)[-8, 8].
B)[-8, 0).
C)[1, 8].
D)[0, 1).
A)[-8, 8].
B)[-8, 0).
C)[1, 8].
D)[0, 1).
[0, 1).
2
In simulation analysis, the ___________ of random variables can be adjusted to determine the impact of the assumptions about the shape of the uncertainty on the results.
A)probability distributions
B)ranges
C)relative frequencies
D)manual generations
A)probability distributions
B)ranges
C)relative frequencies
D)manual generations
probability distributions
3
A(n) ___________ is an input to a simulation model whose value is uncertain and described by a probability distribution.
A)identifier
B)constraint
C)random variable
D)decision variable
A)identifier
B)constraint
C)random variable
D)decision variable
random variable
4
The outcome of a simulation experiment is a(n)
A)objective function.
B)probability distribution for one or more output measures.
C)single number.
D)what-if scenario.
A)objective function.
B)probability distribution for one or more output measures.
C)single number.
D)what-if scenario.
Unlock Deck
Unlock for access to all 59 flashcards in this deck.
Unlock Deck
k this deck
5
Which of the following inferences about a variable of interest can be drawn from the graph given below?
A)The variable is equally likely to take any value between 20 and 40.
B)The variable is more likely to take the value 20 than 40.
C)The variable is more likely to take any value outside the range of 20 and 40.
D)The variable can only take the value 30.
A)The variable is equally likely to take any value between 20 and 40.
B)The variable is more likely to take the value 20 than 40.
C)The variable is more likely to take any value outside the range of 20 and 40.
D)The variable can only take the value 30.
Unlock Deck
Unlock for access to all 59 flashcards in this deck.
Unlock Deck
k this deck
6
In reviewing the graph below, which of the following inferences can be drawn about the monthly salary?
A)The average monthly salary is $3000.
B)The monthly salary is always less than $3000.
C)The monthly salary is always greater than $3000.
D)The range of the monthly salary distribution is $3000 to $5000.
A)The average monthly salary is $3000.
B)The monthly salary is always less than $3000.
C)The monthly salary is always greater than $3000.
D)The range of the monthly salary distribution is $3000 to $5000.
Unlock Deck
Unlock for access to all 59 flashcards in this deck.
Unlock Deck
k this deck
7
A disadvantage of the simple what-if analyses is that
A)there are errors induced as a result of rounding.
B)the optimal solutions are not guaranteed.
C)there is no indication of the likelihood of various output values.
D)it cannot compute alternate optimal solutions.
A)there are errors induced as a result of rounding.
B)the optimal solutions are not guaranteed.
C)there is no indication of the likelihood of various output values.
D)it cannot compute alternate optimal solutions.
Unlock Deck
Unlock for access to all 59 flashcards in this deck.
Unlock Deck
k this deck
8
A ___________ uses repeated random sampling to represent uncertainty in a model representing a real system and that computes the values of model outputs.
A)Monte Carlo simulation
B)what-if analysis
C)deterministic model
D)discrete event simulation
A)Monte Carlo simulation
B)what-if analysis
C)deterministic model
D)discrete event simulation
Unlock Deck
Unlock for access to all 59 flashcards in this deck.
Unlock Deck
k this deck
9
A distribution of a random variable for which values extremely larger or smaller than the mean are increasingly unlikely can possibly be modeled as a(n) _____________ probability distribution.
A)binomial
B)normal
C)exponential
D)gamma
A)binomial
B)normal
C)exponential
D)gamma
Unlock Deck
Unlock for access to all 59 flashcards in this deck.
Unlock Deck
k this deck
10
The values for random variables in a Monte Carlo simulation are
A)selected manually.
B)generated randomly from probability distributions.
C)taken from forecasting analysis.
D)derived secondarily using formulas.
A)selected manually.
B)generated randomly from probability distributions.
C)taken from forecasting analysis.
D)derived secondarily using formulas.
Unlock Deck
Unlock for access to all 59 flashcards in this deck.
Unlock Deck
k this deck
11
A ___________ analysis involves considering alternative values for the random variables and computing the resulting value for the output.
A)random
B)what-if
C)risk
D)cluster
A)random
B)what-if
C)risk
D)cluster
Unlock Deck
Unlock for access to all 59 flashcards in this deck.
Unlock Deck
k this deck
12
The process of evaluating a decision in the face of uncertainty by quantifying the likelihood and magnitude of an undesirable outcome is known as
A)risk analysis.
B)regression analysis.
C)data mining.
D)decision tree analysis.
A)risk analysis.
B)regression analysis.
C)data mining.
D)decision tree analysis.
Unlock Deck
Unlock for access to all 59 flashcards in this deck.
Unlock Deck
k this deck
13
The type of distribution shown in the graph below is
A)uniform.
B)normal.
C)exponential.
D)beta.
A)uniform.
B)normal.
C)exponential.
D)beta.
Unlock Deck
Unlock for access to all 59 flashcards in this deck.
Unlock Deck
k this deck
14
A simulation model extends spreadsheet modeling by
A)extending the range of parameters for which solutions are computed.
B)using real-time values for parameters from the application to formulate solutions.
C)replacing the use of single values for parameters with a range of possible values.
D)using historical data to make predictions about future values and expected trends.
Unlock Deck
Unlock for access to all 59 flashcards in this deck.
Unlock Deck
k this deck
15
A description of the range and relative likelihood of possible values of an uncertain variable is known as a
A)risk analysis.
B)probability distribution.
C)base-case scenario.
D)simulation optimization.
A)risk analysis.
B)probability distribution.
C)base-case scenario.
D)simulation optimization.
Unlock Deck
Unlock for access to all 59 flashcards in this deck.
Unlock Deck
k this deck
16
An input to a simulation model that is selected by the decision maker is known as a
A)random variable.
B)nonnegativity constraint.
C)probable input.
D)controllable input.
A)random variable.
B)nonnegativity constraint.
C)probable input.
D)controllable input.
Unlock Deck
Unlock for access to all 59 flashcards in this deck.
Unlock Deck
k this deck
17
In a ___________, a random variable can take any value in a specified range.
A)discrete probability distribution
B)cumulative distribution
C)relative frequency distribution
D)continuous probability distribution
A)discrete probability distribution
B)cumulative distribution
C)relative frequency distribution
D)continuous probability distribution
Unlock Deck
Unlock for access to all 59 flashcards in this deck.
Unlock Deck
k this deck
18
The choice of the probability distribution for a random variable can be guided by
A)an objective function.
B)likelihood factors.
C)forecasting.
D)historical data.
A)an objective function.
B)likelihood factors.
C)forecasting.
D)historical data.
Unlock Deck
Unlock for access to all 59 flashcards in this deck.
Unlock Deck
k this deck
19
In a base-case scenario, the output is determined by assuming
A)worst values that can be expected for the random variables of a model.
B)the mean trial values for the random variables of a model.
C)best values that can be expected for the random variables of a model.
D)the most likely values for the random variables of a model.
A)worst values that can be expected for the random variables of a model.
B)the mean trial values for the random variables of a model.
C)best values that can be expected for the random variables of a model.
D)the most likely values for the random variables of a model.
Unlock Deck
Unlock for access to all 59 flashcards in this deck.
Unlock Deck
k this deck
20
A set of values for the random variables is called a(n)
A)event.
B)permutation.
C)trial.
D)combination.
A)event.
B)permutation.
C)trial.
D)combination.
Unlock Deck
Unlock for access to all 59 flashcards in this deck.
Unlock Deck
k this deck
21
Which of the following is true of verification?
A)It is largely a debugging task.
B)It requires an agreement among analysts and managers.
C)It deals with the accurate modeling of real system operations.
D)It is performed prior to the development of the computer procedure for simulation.
A)It is largely a debugging task.
B)It requires an agreement among analysts and managers.
C)It deals with the accurate modeling of real system operations.
D)It is performed prior to the development of the computer procedure for simulation.
Unlock Deck
Unlock for access to all 59 flashcards in this deck.
Unlock Deck
k this deck
22
___________ is a measure of dependence between two random variables.
A)Approximation
B)Verification
C)Correlation
D)Validation
A)Approximation
B)Verification
C)Correlation
D)Validation
Unlock Deck
Unlock for access to all 59 flashcards in this deck.
Unlock Deck
k this deck
23
According to the ___________, the sum of independent random variables can be approximated by a normal probability distribution.
A)what-if analysis
B)central limit theorem
C)simulation optimization approach
D)discrete-event simulation method
A)what-if analysis
B)central limit theorem
C)simulation optimization approach
D)discrete-event simulation method
Unlock Deck
Unlock for access to all 59 flashcards in this deck.
Unlock Deck
k this deck
24
The __________ function is used to generate a pseudorandom number in Excel.
A)FREQUENCY()
B)RAND()
C)NORM.INV()
D)ROUND()
A)FREQUENCY()
B)RAND()
C)NORM.INV()
D)ROUND()
Unlock Deck
Unlock for access to all 59 flashcards in this deck.
Unlock Deck
k this deck
25
The __________ function in Excel is used to compute the statistics required to create a histogram.
A)NORM.INV
B)RAND
C)FREQUENCY
D)STDEV.S
A)NORM.INV
B)RAND
C)FREQUENCY
D)STDEV.S
Unlock Deck
Unlock for access to all 59 flashcards in this deck.
Unlock Deck
k this deck
26
Analytic Solver Platform (ASP) cannot guarantee an optimal solution to a simulation optimization model because
A)the optimization problem will have only one local optimal solution due to the linear relationship.
B)of sampling error resulting from nonlinear relationships.
C)it is not possible to compare solutions across runs.
D)of sampling error resulting from the presence of the random variables.
A)the optimization problem will have only one local optimal solution due to the linear relationship.
B)of sampling error resulting from nonlinear relationships.
C)it is not possible to compare solutions across runs.
D)of sampling error resulting from the presence of the random variables.
Unlock Deck
Unlock for access to all 59 flashcards in this deck.
Unlock Deck
k this deck
27
The process of determining that a computer program implements a simulation model as it is intended is known as
A)validation.
B)verification.
C)correlation.
D)optimization.
A)validation.
B)verification.
C)correlation.
D)optimization.
Unlock Deck
Unlock for access to all 59 flashcards in this deck.
Unlock Deck
k this deck
28
Which of the following parameters is required to convert a computer-generated random variable into a uniform random variable?
A)Range of the distribution
B)Mean of the distribution
C)Variance of the distribution
D)Moments of the distribution
A)Range of the distribution
B)Mean of the distribution
C)Variance of the distribution
D)Moments of the distribution
Unlock Deck
Unlock for access to all 59 flashcards in this deck.
Unlock Deck
k this deck
29
The weekly demand for an item in a retail store follows a uniform distribution over the range 70 to 83. What would be the weekly demand if its corresponding computer-generated value is 0.5?
A)90.1
B)83
C)76.5
D)50.85
A)90.1
B)83
C)76.5
D)50.85
Unlock Deck
Unlock for access to all 59 flashcards in this deck.
Unlock Deck
k this deck
30
Which of the following is a disadvantage of using simulation?
A)Experimenting directly with a simulation model is often not feasible.
B)Each simulation run provides only a sample of how the real system will operate.
C)The simulation models are used to describe systems without requiring the assumptions that are required by mathematical models.
D)Simulation models warn against poor decision strategies by projecting disastrous outcomes such as system failures, large financial losses, and so on.
Unlock Deck
Unlock for access to all 59 flashcards in this deck.
Unlock Deck
k this deck
31
For a given mean and standard deviation, the ____________ function in Excel is used to generate a value for the random variable characterized by a normal distribution.
A)NORM.INV
B)RAND
C)VLOOKUP
D)FREQUENCY
A)NORM.INV
B)RAND
C)VLOOKUP
D)FREQUENCY
Unlock Deck
Unlock for access to all 59 flashcards in this deck.
Unlock Deck
k this deck
32
Which of the following is true of simulation optimization using Analytic Solver Platform (ASP)?
A)It is computationally simple and cheap.
B)It can be executed in a very short time.
C)It is an iterative process.
D)It guarantees an optimal solution.
A)It is computationally simple and cheap.
B)It can be executed in a very short time.
C)It is an iterative process.
D)It guarantees an optimal solution.
Unlock Deck
Unlock for access to all 59 flashcards in this deck.
Unlock Deck
k this deck
33
____________ is the process of determining that a simulation model provides an accurate representation of a real system.
A)Regression
B)Verification
C)Consideration
D)Validation
A)Regression
B)Verification
C)Consideration
D)Validation
Unlock Deck
Unlock for access to all 59 flashcards in this deck.
Unlock Deck
k this deck
34
In a(n) ___________ relationship between two quantities, either one quantity never increases as the other increases, or one quantity never decreases as the other increases.
A)monotonic
B)random
C)classified
D)independent
A)monotonic
B)random
C)classified
D)independent
Unlock Deck
Unlock for access to all 59 flashcards in this deck.
Unlock Deck
k this deck
35
All the values of computer-generated random numbers are
A)Poisson distributed.
B)lognormally distributed.
C)uniformly distributed.
D)normally distributed.
A)Poisson distributed.
B)lognormally distributed.
C)uniformly distributed.
D)normally distributed.
Unlock Deck
Unlock for access to all 59 flashcards in this deck.
Unlock Deck
k this deck
36
In Excel, the expression LN(RAND())*(-m) would generate a(n) __________ random variable with mean m.
A)lognormal
B)logarithmic
C)normal
D)exponential
A)lognormal
B)logarithmic
C)normal
D)exponential
Unlock Deck
Unlock for access to all 59 flashcards in this deck.
Unlock Deck
k this deck
37
The Excel function __________ generates integer values between lower and upper bounds.
A)RAND
B)RANDBETWEEN
C)LOWER
D)UPPER
A)RAND
B)RANDBETWEEN
C)LOWER
D)UPPER
Unlock Deck
Unlock for access to all 59 flashcards in this deck.
Unlock Deck
k this deck
38
The random variables corresponding to the interarrival times of customers and the service times of customers are commonly described by a(n) __________ distribution.
A)Poisson
B)Rayleigh
C)lognormal
D)exponential
A)Poisson
B)Rayleigh
C)lognormal
D)exponential
Unlock Deck
Unlock for access to all 59 flashcards in this deck.
Unlock Deck
k this deck
39
In a simulation process, the error of the estimates of the output can be reduced by
A)increasing the range of possible values for the random variables.
B)increasing the number of random variables.
C)increasing the number of trials per simulation.
D)conducting regression analysis to forecast values.
A)increasing the range of possible values for the random variables.
B)increasing the number of random variables.
C)increasing the number of trials per simulation.
D)conducting regression analysis to forecast values.
Unlock Deck
Unlock for access to all 59 flashcards in this deck.
Unlock Deck
k this deck
40
The Excel add-in __________ is used to design a spreadsheet simulation model.
A)Analytic Solver Platform
B)Goal Seek
C)Solver
D)GPSS
A)Analytic Solver Platform
B)Goal Seek
C)Solver
D)GPSS
Unlock Deck
Unlock for access to all 59 flashcards in this deck.
Unlock Deck
k this deck
41
A store is offering a discount on 800 pairs of basketball shoes. The amount of the discount varies and is not revealed to the customer until checkout. The distribution of discounts is given in the below table. Use the negative binomial distribution to approximate the average number of pairs of shoes that a customer has to buy before purchasing two pair with a discount of at least 50%.
Use the negative binomial distribution to approximate the average number of pairs of shoes that a customer has to buy before purchasing two pair with a discount of at least 50%. Unlock Deck
Unlock for access to all 59 flashcards in this deck.
Unlock Deck
k this deck
42
Salemach Corporation is a start-up company that manufactures simple machines. It is interested in analyzing the profit from a new machine. It estimates that the selling price will be $150 per unit and the setup and advertising costs will total $250,000. The company estimates that the per unit raw material cost is uniformly distributed between $50 and $80 and are equally likely. The demand is normally distributed with a mean of 12,000 units and a standard deviation of 3000 units. The probability distribution for a range of labor cost per unit is given below.
a. Obtain estimates for the mean profit, maximum profit, minimum profit, and standard deviation of profit.
b. What is your estimate of the probability of a loss?
a. Obtain estimates for the mean profit, maximum profit, minimum profit, and standard deviation of profit.
b. What is your estimate of the probability of a loss?
Unlock Deck
Unlock for access to all 59 flashcards in this deck.
Unlock Deck
k this deck
43
The quality of a device should be examined in the inspection department sequentially in three steps before it is sent to packaging department. The probability distributions for the time required to complete each of the activities are as follows:
a. Construct a spreadsheet simulation model to estimate the average time spent in inspection department and the standard deviation of the time spent in inspection department.
b. What is the estimated probability that the inspection will be completed in 32 minutes or less?
a. Construct a spreadsheet simulation model to estimate the average time spent in inspection department and the standard deviation of the time spent in inspection department.
b. What is the estimated probability that the inspection will be completed in 32 minutes or less?
Unlock Deck
Unlock for access to all 59 flashcards in this deck.
Unlock Deck
k this deck
44
The stock price of Robin Tires, Inc., listed on the Stock Exchange is currently $20. The following probability distribution shows how the price per share is expected to change over a three-month period:
a. Construct a spreadsheet simulation model that computes the value of the stock profit in 3 months, 6 months, 9 months, and 12 months under the assumption that the change in profit over any 3-month period is independent of the change in profit over any other 3-month period.
b. With the current profit of $20 per share, simulate the profit per share for the next four 3-month periods. What is the average profit in 12 months? What is the standard deviation of the profit in 12 months?
Unlock Deck
Unlock for access to all 59 flashcards in this deck.
Unlock Deck
k this deck
45
An Investment firm offers free financial planning seminars at major hotels for groups of 30 individuals. Each seminar costs them $4,000 and the average first-year commission for each new enrollment is $6,000. The firm estimates that for each individual attending the seminar, there is a 0.05 probability that he/she will enroll.
a. Determine the equation for computing the profit per seminar, given values of the relevant parameters.
b. Construct a spreadsheet simulation model to analyze the profitability of the seminars. Would you recommend the investment firm to continue running the seminars?
a. Determine the equation for computing the profit per seminar, given values of the relevant parameters.
b. Construct a spreadsheet simulation model to analyze the profitability of the seminars. Would you recommend the investment firm to continue running the seminars?
Unlock Deck
Unlock for access to all 59 flashcards in this deck.
Unlock Deck
k this deck
46
Consider the table below with information regarding each activity, immediate predecessors, and duration estimates (in minutes) for each activity.
a. Using the PERT distribution in ASP to represent the duration of each activity, construct a simulation model to compute the total time to complete the task.
b. What is the expected duration of the entire project? What is the standard deviation of the project duration?
c. What is the likelihood that the project will be complete in 26 minutes?
Unlock Deck
Unlock for access to all 59 flashcards in this deck.
Unlock Deck
k this deck
47
A specialty hedge fund is considering the purchase of a Jackson Pollock painting. It estimates the value of the painting to be $185 million. In an auction, both the number of competing bids and the amount of the competing bids is uncertain. The hedge fund has maintained a file summarizing 10 recent art auctions that it believes are similar to the upcoming auction. It is considering a bid of $163 million and would like to evaluate its chances of winning the upcoming auction with this bid.
a. Construct a spreadsheet simulation model for this auction. Use a discrete uniform distribution between the minimum and maximum number of bidders in the 10 observed auctions to model the number of bidders in the Jackson Pollock auction. Fit a realistic distribution to the bid data to generate values of competing bid amounts. Use ASP to apply simulation optimization to determine the hedge fund's bid amount that maximizes the expected return = P(winning auction)*(185 - bid amount). Hint: Placing reasonable bounds on the highest and lowest possible bid amount will greatly assist the optimization algorithm.
b. What is the probability that the hedge fund wins the auction if it bids the amount that maximizes its expected return?
Unlock Deck
Unlock for access to all 59 flashcards in this deck.
Unlock Deck
k this deck
48
A company has produced a new battery with an estimated mean lifetime of 60 hours. Management also believes that the standard deviation is 4.5 hours and that battery hours are normally distributed. To promote the new battery, management has offered to refund some money if the battery fails to reach 50 hours before the battery needs to be recharged. Specifically, for batteries with a lifetime below 50 hours, the management will refund a customer $50 per hour short of 50 hours.
a. For each battery sold, what is the expected cost of the promotion?
b. What hours should the company set the promotion claim if it wants the expected cost to be $0.50?
a. For each battery sold, what is the expected cost of the promotion?
b. What hours should the company set the promotion claim if it wants the expected cost to be $0.50?
Unlock Deck
Unlock for access to all 59 flashcards in this deck.
Unlock Deck
k this deck
49
The manager of a company decides to arrange a party for being promoted and has invited 50 guests for dinner. The following table contains information on the number of RSVP'ed guests. He assumes that 12 people will not turn up. He also estimates that 13 guests planning to come solo has a 65 percent chance of attending alone, a 30 percent chance of not attending, and a 5 percent chance of bringing a companion. For each of the 20 guests who plan to bring a companion, there is a 75 percent chance that she or he will attend with a companion, a 10 percent chance of attending solo, and a 15 percent chance of not attending at all. For the 5 people who have not responded, the wedding planner assumes that there is an 85 percent chance that each will not attend, a 10 percent chance they will attend alone, and a 5 percent chance they will attend with a companion.
a. Assist the manager by constructing a spreadsheet simulation model to determine the expected number of guests who will attend the party.
b. Use the Monte Carlo simulation model to determine X, the minimum number of guests for whom the dinner needs to be ordered, so that there is at least a 95 percent chance that the actual attendance is less than or equal to X. What is the best estimate for the value of X?
Unlock Deck
Unlock for access to all 59 flashcards in this deck.
Unlock Deck
k this deck
50
A football tournament is conducted between Team-A and Team-B of a college and the winner being the first team to win four games of seven games. The probability that Team-A wins each game are as follows:
a. Set up a spreadsheet simulation model in which whether Team-A wins each game is a random variable.
b. What is the probability that the Team- A win the tournament?
c. What is the average number of games played regardless of winner?
a. Set up a spreadsheet simulation model in which whether Team-A wins each game is a random variable.
b. What is the probability that the Team- A win the tournament?
c. What is the average number of games played regardless of winner?
Unlock Deck
Unlock for access to all 59 flashcards in this deck.
Unlock Deck
k this deck
51
An entrepreneur who operates a cellular phone store orders inventory of cell phones based on four internal memory specifications - 8 GB, 16 GB, 32 GB, and 64 GB. She wants to evaluate her inventory ordering policy for the phones with four different amounts of internal memory. Any phone unsold at the end of a period is kept in inventory for the next sales period and incurs a holding cost expressed as 10% of the cost per unit per period. If demand during a period exceeds supply for a phone, then sale is lost. The data on the cost and selling prices of the cell phones categorized by these memory specifications are known, and representative data on the past sales are also available. Past Sales:
a. Construct a spreadsheet simulation model to estimate the total profit the entrepreneur earns in a period when ordering 300 units of each cell phone. To model the respective cell phone demands, fit a realistic distribution to the sales data. What is the average total profit? What is the estimated likelihood that the entrepreneur makes less than $10,000 next period?
b. Using Spearman rank correlation, compute the correlations between the demands for the cells phones based on the four memory specifications. Incorporate a correlation matrix to captures the interrelationships between the demands for each cell phone type. What is the average total profit? What is the estimated likelihood that the entrepreneur makes less than $10,000 next period? Comparing these answers to (a), conclude how the correlated demand affects the model's implications.
Past Sales: a. Construct a spreadsheet simulation model to estimate the total profit the entrepreneur earns in a period when ordering 300 units of each cell phone. To model the respective cell phone demands, fit a realistic distribution to the sales data. What is the average total profit? What is the estimated likelihood that the entrepreneur makes less than $10,000 next period?
b. Using Spearman rank correlation, compute the correlations between the demands for the cells phones based on the four memory specifications. Incorporate a correlation matrix to captures the interrelationships between the demands for each cell phone type. What is the average total profit? What is the estimated likelihood that the entrepreneur makes less than $10,000 next period? Comparing these answers to (a), conclude how the correlated demand affects the model's implications.
Unlock Deck
Unlock for access to all 59 flashcards in this deck.
Unlock Deck
k this deck
52
A toy company designs a new toy car this season. The fixed cost to produce the car is $120,000. The variable cost which includes raw materials, production, and shipping costs, is $40 per car. The company will sell the car for $48 each. A distributor has agreed to pay the toy company $12 for each car remaining after the retail selling season. Forecasts are for expected sales of 55,000 toy cars with a standard deviation of 9000. The normal probability distribution is assumed to be a good description of the demand. The management has tentatively decided to produce 55,000 units (the same as average demand), but it wants to conduct an analysis regarding this production quantity before finalizing the decision.
a. Create a what-if spreadsheet model using formula that relate the values of production quantity, demand, sales, revenue from sales, amount of surplus, revenue from sales of surplus, total cost, and net profit. What is the profit corresponding to average demand (55,000 units)?
b. Modeling demand as a normal random variable with a mean of 55,000 and a standard deviation of 9000, simulate the sales of the toy car using a production quantity of 55,000 units. What is the estimate of the average profit associated with the production quantity of 55,000 cars? How does this compare to the profit corresponding to the average demand (as computed in part a)?
c. Before making a final decision on the production quantity, management wants an analysis of a more aggressive 65,000-unit production quantity and a more conservative 45,000-unit production quantity. Run your simulation with these two production quantities. What is the mean profit associated with each?
Unlock Deck
Unlock for access to all 59 flashcards in this deck.
Unlock Deck
k this deck
53
A company has improved its anti-virus program and has released a new version. Assume there is a 0.6 probability that the users of this anti-virus will upgrade the version in any particular year. That is, the upgrade year of the user is a geometric random variable. The revenue generated from the upgrade (when it occurs) follows a normal distribution with a mean of $80,000 and a standard deviation of $22,000.
a. Complete a simulation model that analyzes the net present value of the revenue from the user upgrade. Use an annual discount rate of 8 percent.
b. What is the average net present value earned by the company?
c. What is the standard deviation of net present value?
a. Complete a simulation model that analyzes the net present value of the revenue from the user upgrade. Use an annual discount rate of 8 percent.
b. What is the average net present value earned by the company?
c. What is the standard deviation of net present value?
Unlock Deck
Unlock for access to all 59 flashcards in this deck.
Unlock Deck
k this deck
54
Team X is scheduled to play against Team Y in an upcoming game in Baseball's World Series. Assume that each player's point production can be represented as an integer uniform variable with the ranges provided in the following table:
a. Develop a spreadsheet model that simulates the points scored by each team.
b. What are the average and standard deviation of points scored by Team X? What is the shape of the distribution of points scored by Team X?
c. What are the average and standard deviation of points scored by Team Y? What is the shape of the distribution of points scored by Team Y?
d. Let Point Differential = Team X points - Team Y points. What is the average point differential between the two teams? What is the standard deviation in the point differential? What is the shape of the point differential distribution?
e. What is the probability that the Team X scores more points than the Team Y?
Unlock Deck
Unlock for access to all 59 flashcards in this deck.
Unlock Deck
k this deck
55
A specialty hedge fund is considering the purchase of a Jackson Pollock painting. It estimates the value of the painting to be $185 million. In an auction, both the number of competing bids and the amount of the competing bids is uncertain. The hedge fund has maintained a file summarizing 10 recent art auctions that it believes are similar to the upcoming auction. It is considering a bid of $163 million and would like to evaluate its chances of winning the upcoming auction with this bid.
a. Construct a spreadsheet simulation model to determine the likelihood of the hedge fund winning the auction. Use a discrete uniform distribution between the minimum and maximum number of bidders in the 10 observed auctions to model the number of bidders in the Jackson Pollock auction. Fit a realistic distribution to the bid data to generate values of competing bid amounts.
b. For a bid amount of $163 million, estimate the probability of the hedge fund winning the auction?
Unlock Deck
Unlock for access to all 59 flashcards in this deck.
Unlock Deck
k this deck
56
A store is offering a discount on 800 pairs of basketball shoes. The amount of the discount varies and is not revealed to the customer until checkout. The distribution of discounts is given in the below table. How many pairs of shoes does a customer have to buy so that, on average, he has purchased five containing a 65% or 90% discount? (Hint: Use the hypergeometric distribution in ASP to answer this question.)
How many pairs of shoes does a customer have to buy so that, on average, he has purchased five containing a 65% or 90% discount? (Hint: Use the hypergeometric distribution in ASP to answer this question.) Unlock Deck
Unlock for access to all 59 flashcards in this deck.
Unlock Deck
k this deck
57
Sunseel Industries produces different types of raw materials and it is interested in using simulation to estimate the profit per unit for its new product X. The selling price for the product will be $40 per unit. Probability distributions for the raw material cost, the production cost, and the marketing cost are estimated as follows.
a. Compute profit per unit for the base case, worst case, and best case.
b. Construct a simulation model to estimate the mean profit per unit.
c. Management believes the project may not be sustainable if the profit per unit is less than $2. Use simulation to estimate the probability the profit per unit will be less than $2.
Unlock Deck
Unlock for access to all 59 flashcards in this deck.
Unlock Deck
k this deck
58
A distributor has generated a rough estimate of aftershave demand at their retails store. The distributor is confident that demand will range from 100 to 650. The following table lists weights for demand values within this range.
The distributor pays a wholesale price of $21 per aftershave and then sells at a retail price of $31.
a. Construct a spreadsheet model that computes net profit corresponding to a given level of demand and specified order quantity. Model demand as a random variable with ASP's custom general distribution.
b. Using simulation optimization, determine the order quantity that maximizes expected profit. What is the probability of running out of aftershave at this order quantity?
c. How many aftershaves does the distributor need to order so that the probability of running out of aftershaves is only 25 percent? How much expected profit will the distributor lose if he orders this amount rather than the amount from part b?
Unlock Deck
Unlock for access to all 59 flashcards in this deck.
Unlock Deck
k this deck
59
A tourist bus can accommodate 80 people and currently books up to 80 reservations. Past data shows that the tourist bus always accommodates all 80 reservations but that, on average, two people do not show up. To capture additional profit, the travel agent is considering an overbooking strategy in which he would accept 82 reservations even though the tourist bus can accommodate only 80 people. The travel agent believes that he will be able to always book all 82 reservations. The probability distribution for the number of people showing up when 82 reservations are accepted is estimated as follows:
The travel agent receives a marginal profit of $110 for each passenger who books a reservation (regardless whether they show up). The travel agent will also incur a cost for any passenger denied seating on the bus. This cost covers added expenses of rescheduling the passenger as well as loss of goodwill, estimated to be $160 per passenger. Develop a spreadsheet simulation model for this overbooking system. Simulate the number of passengers showing up.
a. What is the average net profit for each tourist bus with the overbooking strategy?
b. What is the probability that the net profit with the overbooking strategy will be less than the net profit without overbooking (80 × $110 = $8,800)?
c. Explain how your simulation model could be used to evaluate other overbooking levels such as 81, 83, and 84 and for recommending a best overbooking strategy.
Unlock Deck
Unlock for access to all 59 flashcards in this deck.
Unlock Deck
k this deck
Unlock Deck
Unlock for access to all 59 flashcards in this deck.


