Deck 6: Statistical Inference
Full screen (f)
Question
Question
Question
The population parameter value and the point estimate differ because a sample is not a census of the entire population, but it is being used to develop the 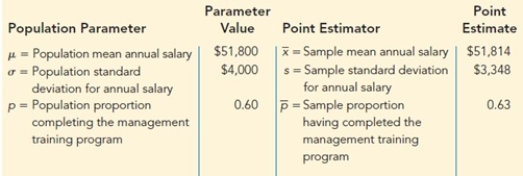
A)population parameter.
B)point estimate.
C)population mean.
D)standard error.
A)population parameter.
B)point estimate.
C)population mean.
D)standard error.
Question
Question
Question
Question
Question
Question
Question
Question
Question
Question
Question
Question
Question
Question
Question
Question
Question
Question
Question
Question
Question
Question
Question
Question
Question
Question
Question
Question
Question
Question
Question
Question
Question
Question
Question
Question
Question
Question
Question
Question
Question
Question
Question
Question
Question
Question
Question
Question
Question
Question
Question
Question
Question
Question
Question
Question
Question
Question
Question

Unlock Deck
Sign up to unlock the cards in this deck!
Unlock Deck
Unlock Deck
1/62
Play
Full screen (f)
Deck 6: Statistical Inference
1
The finite correction factor should be used in the computation of the standard deviation of the sample mean and the standard population when n/N is
A)greater than 0.05.
B)greater than 0.5.
C)less than 0.05.
D)less than 0.5.
A)greater than 0.05.
B)greater than 0.5.
C)less than 0.05.
D)less than 0.5.
greater than 0.05.
2
The CEO of a company wants to estimate the percent of employees that use company computers to go on Facebook during work hours with 95% confidence. He selects a random sample of 150 of the employees and finds that 53 of them logged onto Facebook that day. What is the point estimate of the proportion of the population that logged onto Facebook that day?
A)0.25
B)0.35
C)0.53
D)0.65
A)0.25
B)0.35
C)0.53
D)0.65
0.35
3
The population parameter value and the point estimate differ because a sample is not a census of the entire population, but it is being used to develop the
A)population parameter.
B)point estimate.
C)population mean.
D)standard error.
A)population parameter.
B)point estimate.
C)population mean.
D)standard error.
point estimate.
4
The purpose of statistical inference is to make estimates or draw conclusions about a
A)sample based upon information obtained from the population.
B)population based upon information obtained from the sample.
C)statistic based upon information obtained from the population.
D)mean of the sample based upon the mean of the population.
A)sample based upon information obtained from the population.
B)population based upon information obtained from the sample.
C)statistic based upon information obtained from the population.
D)mean of the sample based upon the mean of the population.
Unlock Deck
Unlock for access to all 62 flashcards in this deck.
Unlock Deck
k this deck
5
When the expected value of the point estimator is equal to the population parameter it estimates, it is said to be
A)unbiased.
B)precise.
C)symmetric.
D)predicted.
A)unbiased.
B)precise.
C)symmetric.
D)predicted.
Unlock Deck
Unlock for access to all 62 flashcards in this deck.
Unlock Deck
k this deck
6
A simple random sample of 31 observations was taken from a large population. The sample mean equals 5. Five is a
A)population parameter.
B)point estimate.
C)population mean.
D)standard error.
A)population parameter.
B)point estimate.
C)population mean.
D)standard error.
Unlock Deck
Unlock for access to all 62 flashcards in this deck.
Unlock Deck
k this deck
7
If the expected value of the sample statistic is equal to the population parameter being estimated, the sample statistic is said to
A)have low variability.
B)be an unbiased estimator of the population parameter.
C)have high precision.
D)be a random estimator of the population parameter.
A)have low variability.
B)be an unbiased estimator of the population parameter.
C)have high precision.
D)be a random estimator of the population parameter.
Unlock Deck
Unlock for access to all 62 flashcards in this deck.
Unlock Deck
k this deck
8
An estimate of a population parameter that provides an interval of values believed to contain the value of the parameter is known as the
A)confidence level.
B)interval estimate
C)parameter level.
D)population estimate.
A)confidence level.
B)interval estimate
C)parameter level.
D)population estimate.
Unlock Deck
Unlock for access to all 62 flashcards in this deck.
Unlock Deck
k this deck
9
The value of the ___________ is used to estimate the value of the population parameter.
A)population statistic
B)sample parameter
C)population estimate
D)sample statistic
A)population statistic
B)sample parameter
C)population estimate
D)sample statistic
Unlock Deck
Unlock for access to all 62 flashcards in this deck.
Unlock Deck
k this deck
10
The basis for using a normal probability distribution to approximate the sampling distribution of the sample means and population mean is
A)Chebyshev's theorem.
B)the empirical rule.
C)the central limit theorem.
D)Bayes' theorem.
A)Chebyshev's theorem.
B)the empirical rule.
C)the central limit theorem.
D)Bayes' theorem.
Unlock Deck
Unlock for access to all 62 flashcards in this deck.
Unlock Deck
k this deck
11
The t value for a 99% confidence interval estimation based upon a sample of size 10 is
A)1.645.
B)1.812.
C)2.576.
D)3.169.
A)1.645.
B)1.812.
C)2.576.
D)3.169.
Unlock Deck
Unlock for access to all 62 flashcards in this deck.
Unlock Deck
k this deck
12
As the number of degrees of freedom for a t distribution increases, the difference between the t distribution and the standard normal distribution
A)becomes larger.
B)becomes smaller.
C)stays the same.
D)fluctuates.
A)becomes larger.
B)becomes smaller.
C)stays the same.
D)fluctuates.
Unlock Deck
Unlock for access to all 62 flashcards in this deck.
Unlock Deck
k this deck
13
The random numbers generated using Excels RAND function follows a ________________ probability distribution between 0 and 1.
A)normal
B)uniform
C)binomial
D)random
A)normal
B)uniform
C)binomial
D)random
Unlock Deck
Unlock for access to all 62 flashcards in this deck.
Unlock Deck
k this deck
14
The CEO of a company wants to estimate the percent of employees that use company computers to go on Facebook during work hours with 95% confidence. He selects a random sample of 150 of the employees and finds that 53 of them logged onto Facebook that day. What is the estimate of the standard error of the proportion
A)0.039
B)0.050
C)0.350
D)0.455
A)0.039
B)0.050
C)0.350
D)0.455
Unlock Deck
Unlock for access to all 62 flashcards in this deck.
Unlock Deck
k this deck
15
For a population with an unknown distribution, the form of the sampling distribution of the sample mean is
A)approximately normal for small sample sizes.
B)exactly normal for large sample sizes.
C)exactly normal for small sample sizes.
D)approximately normal for large sample sizes.
A)approximately normal for small sample sizes.
B)exactly normal for large sample sizes.
C)exactly normal for small sample sizes.
D)approximately normal for large sample sizes.
Unlock Deck
Unlock for access to all 62 flashcards in this deck.
Unlock Deck
k this deck
16
In order to determine an interval for the mean of a population with unknown standard deviation a sample of 24 items is selected. The mean of the sample is determined to be 23. The number of degrees of freedom for reading the t value is
A)21.
B)22.
C)23.
D)24.
A)21.
B)22.
C)23.
D)24.
Unlock Deck
Unlock for access to all 62 flashcards in this deck.
Unlock Deck
k this deck
17
A statistics teacher started class one day by drawing the names of 10 students out of a hat and asked them to do as many pushups as they could. The 10 randomly selected students averaged 15 pushups per person with a standard deviation of 9 pushups.Suppose the distribution of the population of number of pushups that can be done is approximately normal. What is the standard error of the mean?
A)0.900
B)2.876
C)3.061
D)4.743
A)0.900
B)2.876
C)3.061
D)4.743
Unlock Deck
Unlock for access to all 62 flashcards in this deck.
Unlock Deck
k this deck
18
A simple random sample of size n from a finite population of size N is a sample selected such that each possible sample of size
A)N and n have the same probability of being selected.
B)n has a probability of 0.5 of being selected.
C)n has a probability of 0.05 of being selected.
D)n has the same probability of being selected.
A)N and n have the same probability of being selected.
B)n has a probability of 0.5 of being selected.
C)n has a probability of 0.05 of being selected.
D)n has the same probability of being selected.
Unlock Deck
Unlock for access to all 62 flashcards in this deck.
Unlock Deck
k this deck
19
A random sample selected from an infinite population is a sample selected such that each element selected comes from the same ________________ and each element is selected ______________
A)population; independently.
B)population; simultaneously.
C)sample; independently.
D)sample; simultaneously.
A)population; independently.
B)population; simultaneously.
C)sample; independently.
D)sample; simultaneously.
Unlock Deck
Unlock for access to all 62 flashcards in this deck.
Unlock Deck
k this deck
20
A parameter is a numerical measure from a population, such as ?
A)?u.
B) ?.
C)?s.
D)? .
A)?u.
B) ?.
C)?s.
D)? .
Unlock Deck
Unlock for access to all 62 flashcards in this deck.
Unlock Deck
k this deck
21
A sample of 37 AA batteries had a mean lifetime of 584 hours. A 95% confidence interval for the population mean was 579.2 < μ < 588.8. Which statements is the correct interpretation of the results?
A)We are 95% confident that the mean lifetime of all the bulbs in the population is between 579.2 hours and 588.8 hours.
B)The probability that the population mean is between 579.2 hours and 588.8 hours is 0.95.
C)95% of the light bulbs in the sample had lifetimes between 579.2 hours and 588.8 hours.
D)None of these statements correctly interpret the results.
Unlock Deck
Unlock for access to all 62 flashcards in this deck.
Unlock Deck
k this deck
22
What are the two decisions that you can make from performing a hypothesis test?
A)Reject the null hypothesis; Fail to reject the null hypothesis
B)Accept the null hypothesis; Accept the alternative hypothesis
C)Make a type I error; Make a type II error
D)Reject the alternative hypothesis; Accept the null hypothesis
A)Reject the null hypothesis; Fail to reject the null hypothesis
B)Accept the null hypothesis; Accept the alternative hypothesis
C)Make a type I error; Make a type II error
D)Reject the alternative hypothesis; Accept the null hypothesis
Unlock Deck
Unlock for access to all 62 flashcards in this deck.
Unlock Deck
k this deck
23
In interval estimation, as the sample size becomes larger, the interval estimate
A)becomes narrower.
B)becomes wider.
C)remains the same, since the mean is not changing.
D)gets closer to 1.96.
A)becomes narrower.
B)becomes wider.
C)remains the same, since the mean is not changing.
D)gets closer to 1.96.
Unlock Deck
Unlock for access to all 62 flashcards in this deck.
Unlock Deck
k this deck
24
A statistics teacher started class one day by drawing the names of 10 students out of a hat and asked them to do as many pushups as they could. The 10 randomly selected students averaged 15 pushups per person with a standard deviation of 9 pushups.Suppose the distribution of the population of number of pushups that can be done is approximately normal. If we would like to capture the population mean with 95% confidence the margin of error would be ??
A)
B)?
C)?
D)?
A)
B)?
C)?
D)?
Unlock Deck
Unlock for access to all 62 flashcards in this deck.
Unlock Deck
k this deck
25
The average number of hours for a random sample of mail order pharmacists from company A was 50.1 hours last year. It is believed that changes to medical insurance have led to a reduction in the average work week. To test the validity of this belief, the hypotheses are
A)H0: U > 50.1, Ha : U < 50.1.
B)H0: U = 50.1, Ha : U ≠ 50.1.
C)H0: U ≤ 50.1, Ha : U > 50.1.
D)H0: U ≥ 50.1, Ha : U < 50.1.
A)H0: U > 50.1, Ha : U < 50.1.
B)H0: U = 50.1, Ha : U ≠ 50.1.
C)H0: U ≤ 50.1, Ha : U > 50.1.
D)H0: U ≥ 50.1, Ha : U < 50.1.
Unlock Deck
Unlock for access to all 62 flashcards in this deck.
Unlock Deck
k this deck
26
A large manufacturing plant has analyzed the amount of time required to produce an electrical part and determined that the times follow a normal distribution with mean time ? = 45 hours. The production manager has developed a new procedure for producing the part. He believes that the new procedure will decrease the population mean amount of time required to produce the part. After training a group of production line workers, a random sample of 25 parts will be selected and the average amount of time required to produce them will be determined. If the switch is made to the new procedure, the cost to implement the new procedure will be more than offset by the savings in manpower required to produce the parts. Use the hypotheses: Ho: ? ? .45 hours and Ha: ? < 45 hours. Determine the p-value of the test statistic if the sample mean amount of time is = 43.118 hours with the sample standard deviation s = 5.5 hours.
A)?0.04973
B)0.04999
C)?0.95818
D)0.04354
A)?0.04973
B)0.04999
C)?0.95818
D)0.04354
Unlock Deck
Unlock for access to all 62 flashcards in this deck.
Unlock Deck
k this deck
27
The proportion of dental procedures that are extractions is 0.16. Which of the following exemplifies a type I error in this situation?
A)Reject the claim that the proportion of dental procedures that are extractions is 0.16 when the proportion is actually different from 0.16.
B)Fail to reject the claim that the proportion of dental procedures that are extractions is 0.16 when the proportion is actually 0.16
C)Reject the claim that the proportion of dental procedures that are extractions is 0.16 when the proportion is actually 0.16
D)Fail to reject the claim that the proportion of dental procedures that are extractions is 0.16 when the proportion is actually different from 0.16
Unlock Deck
Unlock for access to all 62 flashcards in this deck.
Unlock Deck
k this deck
28
Two approaches to drawing a conclusion in a hypothesis test are
A)p-value and critical value.
B)one-tailed and two-tailed.
C)Type I and Type II.
D)null and alternative.
A)p-value and critical value.
B)one-tailed and two-tailed.
C)Type I and Type II.
D)null and alternative.
Unlock Deck
Unlock for access to all 62 flashcards in this deck.
Unlock Deck
k this deck
29
In a random sample of 400 registered voters, 120 indicated they plan to vote for Trump for President. Determine a 95% confidence interval for the proportion of all the registered voters who will vote for Trump.
A)(0.25, 0.34)
B)(0.27, 0.32)
C)(0.29, 0.30)
D)Cannot be determined from the information given.
A)(0.25, 0.34)
B)(0.27, 0.32)
C)(0.29, 0.30)
D)Cannot be determined from the information given.
Unlock Deck
Unlock for access to all 62 flashcards in this deck.
Unlock Deck
k this deck
30
A pizza shop advertises that they deliver in 30 minutes or less or it is free. People who live in homes that are located on the opposite side of town believe it will take the pizza shop longer than 30 minutes to make and deliver the pizza. A random sample of 50 deliveries to homes across town was taken and the mean time was computed to be 32 minutes. What is the appropriate symbol to represent the value, 32?
A)?u = 32
B)
C)?n =32
D)
A)?u = 32
B)
C)?n =32
D)
Unlock Deck
Unlock for access to all 62 flashcards in this deck.
Unlock Deck
k this deck
31
The CEO of a company wants to estimate the percent of employees that use company computers to go on Facebook during work hours with 95% confidence.He selects a random sample of 150 of the employees and finds that 53 of them logged onto Facebook that day.Compute the 95% confidence interval for the population proportion.
A)?
B)?
C)?
D)?
A)?
B)?
C)?
D)?
Unlock Deck
Unlock for access to all 62 flashcards in this deck.
Unlock Deck
k this deck
32
A pizza shop advertises that they deliver in 30 minutes or less or it is free. People who live in homes that are located on the opposite side of town believe it will take the pizza shop longer than 30 minutes to make and deliver the pizza. Write the null and alternative hypotheses that can be used to conduct a significance test.
A)H0: m ≤ 30, Ha: m > 30
B)H0: m < 30, Ha: m > 30
C)H0: m ≥ 30, Ha: m < 30
D)H0: m > 30, Ha: m < 30
A)H0: m ≤ 30, Ha: m > 30
B)H0: m < 30, Ha: m > 30
C)H0: m ≥ 30, Ha: m < 30
D)H0: m > 30, Ha: m < 30
Unlock Deck
Unlock for access to all 62 flashcards in this deck.
Unlock Deck
k this deck
33
A one-tailed test is a hypothesis test in which the rejection region is
A)in both tails of the sampling distribution.
B)in one tail of the sampling distribution.
C)only in the lower tail of the sampling distribution.
D)only in the upper tail of the sampling distribution.
A)in both tails of the sampling distribution.
B)in one tail of the sampling distribution.
C)only in the lower tail of the sampling distribution.
D)only in the upper tail of the sampling distribution.
Unlock Deck
Unlock for access to all 62 flashcards in this deck.
Unlock Deck
k this deck
34
A Type I error is committed when
A)a true alternative hypothesis is not accepted.
B)a true null hypothesis is rejected.
C)the critical value is greater than the value of the test statistic.
D)the validity of a claim was rejected.
A)a true alternative hypothesis is not accepted.
B)a true null hypothesis is rejected.
C)the critical value is greater than the value of the test statistic.
D)the validity of a claim was rejected.
Unlock Deck
Unlock for access to all 62 flashcards in this deck.
Unlock Deck
k this deck
35
A large manufacturing plant has analyzed the amount of time required to produce an electrical part and determined that the times follow a normal distribution with mean time ? = 45 hours. The production manager has developed a new procedure for producing the part. He believes that the new procedure will decrease the population mean amount of time required to produce the part. After training a group of production line workers, a random sample of 25 parts will be selected and the average amount of time required to produce them will be determined. If the switch is made to the new procedure, the cost to implement the new procedure will be more than offset by the savings in manpower required to produce the parts. Use the hypotheses: Ho: ? ? .45 hours and Ha: ? < 45 hours. If the sample mean amount of time is = 43.118 hours with the sample standard deviation s = 5.5 hours, give the appropriate conclusion, for ? = 0.025. ?
A)Do not reject Ho, do not switch to the new procedure.
B)Reject Ho, switch to the new procedure.
C)Reject Ho, do not switch to the new procedure.
D)Do not reject Ho, switch to the new procedure.
A)Do not reject Ho, do not switch to the new procedure.
B)Reject Ho, switch to the new procedure.
C)Reject Ho, do not switch to the new procedure.
D)Do not reject Ho, switch to the new procedure.
Unlock Deck
Unlock for access to all 62 flashcards in this deck.
Unlock Deck
k this deck
36
Larger values of have the disadvantage of increasing the probability of making a
A)Type I error.
B)Type II error.
C)random sampling error.
D)normal probability error.
A)Type I error.
B)Type II error.
C)random sampling error.
D)normal probability error.
Unlock Deck
Unlock for access to all 62 flashcards in this deck.
Unlock Deck
k this deck
37
Using an α = 0.04 a confidence interval for a population proportion is determined to be 0.65 to 0.75. If the level of significance is decreased, the interval for the population proportion
A)becomes narrower.
B)becomes wider.
C)does not change.
D)remains the same.
A)becomes narrower.
B)becomes wider.
C)does not change.
D)remains the same.
Unlock Deck
Unlock for access to all 62 flashcards in this deck.
Unlock Deck
k this deck
38
A statistics teacher started class one day by drawing the names of 10 students out of a hat and asked them to do as many pushups as they could. The 10 randomly selected students averaged 15 pushups per person with a standard deviation of 9 pushups.Suppose the distribution of the population of number of pushups that can be done is approximately normal. The 95% confidence interval for the true mean number of pushups that can be done is
A)5.75 to 24.25.
B)8.56 to 21.40.
C)11.31 to 18.55.
D)13.02 to 16.98.
A)5.75 to 24.25.
B)8.56 to 21.40.
C)11.31 to 18.55.
D)13.02 to 16.98.
Unlock Deck
Unlock for access to all 62 flashcards in this deck.
Unlock Deck
k this deck
39
A fast food restaurant has automatic drink dispensers to help fill orders more quickly. When the 12 ounce button is pressed, they would like for exactly 12 ounces of beverage to be dispensed. There is, however, undoubtedly some variation in this amount. The company does not want the machine to systematically over fill or under fill the cups. Which of the following gives the correct set of hypotheses
A)H0: U > 12, Ha : U < 12.
B)H0: U = 12, Ha : U ≠ 12.
C)H0: U ≤ 12, Ha : U > 12.
D)H0: U ≥ 12, Ha : U < 12.
A)H0: U > 12, Ha : U < 12.
B)H0: U = 12, Ha : U ≠ 12.
C)H0: U ≤ 12, Ha : U > 12.
D)H0: U ≥ 12, Ha : U < 12.
Unlock Deck
Unlock for access to all 62 flashcards in this deck.
Unlock Deck
k this deck
40
A null and alternative hypothesis for a one proportion z test are given as H0: p = 0.8, Ha: p < 0.8. This hypothesis test is
A)lower-tailed.
B)upper-tailed.
C)two-tailed.
D)these hypotheses are incorrectly stated.
A)lower-tailed.
B)upper-tailed.
C)two-tailed.
D)these hypotheses are incorrectly stated.
Unlock Deck
Unlock for access to all 62 flashcards in this deck.
Unlock Deck
k this deck
41
As a rule of thumb, the sampling distribution of the sample proportions can be approximated by a normal probability distribution when
Unlock Deck
Unlock for access to all 62 flashcards in this deck.
Unlock Deck
k this deck
42
A student wants to determine if pennies are really fair, meaning equally likely to land heads up or tails up. He flips a random sample of 50 pennies and finds that 28 of them land heads up. What are the appropriate null and alternative hypotheses?
A)H0: p ≥ 0.5, Ha : p < 0.5
B)H0: p ≤ 0.5, Ha : p ≠ 0.5
C)H0: p = 0.5, Ha : p > 0.5
D)H0: p ≥ 28, Ha : p < 28
A)H0: p ≥ 0.5, Ha : p < 0.5
B)H0: p ≤ 0.5, Ha : p ≠ 0.5
C)H0: p = 0.5, Ha : p > 0.5
D)H0: p ≥ 28, Ha : p < 28
Unlock Deck
Unlock for access to all 62 flashcards in this deck.
Unlock Deck
k this deck
43
A sample of 92 observations is taken from an infinite population. The sampling distribution of is approximately normal because of what theorem?
Unlock Deck
Unlock for access to all 62 flashcards in this deck.
Unlock Deck
k this deck
44
You are _______________ to commit a Type I error using the 0.05 level of significance than using the 0.01 level of significance.
A)more likely
B)less likely
C)equally likely
D)twice as likely
A)more likely
B)less likely
C)equally likely
D)twice as likely
Unlock Deck
Unlock for access to all 62 flashcards in this deck.
Unlock Deck
k this deck
45
What is the general form of an interval estimate?
Unlock Deck
Unlock for access to all 62 flashcards in this deck.
Unlock Deck
k this deck
46
The medical director of a company looks at the medical records of all 50 employees and finds that the mean systolic blood pressure for these employees is 126.07.The value of 126.07 is symbolized by.
Unlock Deck
Unlock for access to all 62 flashcards in this deck.
Unlock Deck
k this deck
47
Numerical characteristics of the population are called
Unlock Deck
Unlock for access to all 62 flashcards in this deck.
Unlock Deck
k this deck
48
Determine whether the alternative hypothesis is left-tailed, right-tailed, or two-tailed: Ho: μ = 11 Ha: μ > 11
A)left-tailed.
B)right-tailed.
C)two-tailed.
D)there is not enough information to make a determination.
A)left-tailed.
B)right-tailed.
C)two-tailed.
D)there is not enough information to make a determination.
Unlock Deck
Unlock for access to all 62 flashcards in this deck.
Unlock Deck
k this deck
49
Which statement is NOT true?
A)Rejecting the null hypothesis when it is true is a Type I error.
B)The probability of making a Type I error is symbolized by α.
C)Failing to reject the null hypothesis when it is false is a Type I error.
D)Type II error can occur for both one and two-tailed tests.
A)Rejecting the null hypothesis when it is true is a Type I error.
B)The probability of making a Type I error is symbolized by α.
C)Failing to reject the null hypothesis when it is false is a Type I error.
D)Type II error can occur for both one and two-tailed tests.
Unlock Deck
Unlock for access to all 62 flashcards in this deck.
Unlock Deck
k this deck
50
The sample mean is the point estimator of what population parameter?
Unlock Deck
Unlock for access to all 62 flashcards in this deck.
Unlock Deck
k this deck
51
Statistical significance at the 0.01 level is___________ than significance at the 0.05 level .
A)more difficult to achieve
B)easier to achieve
C)less costly
D)less informative
A)more difficult to achieve
B)easier to achieve
C)less costly
D)less informative
Unlock Deck
Unlock for access to all 62 flashcards in this deck.
Unlock Deck
k this deck
52
A simple random sample of 11 observations from a population containing 400 female soccer players was taken, and the following values were obtained.
48 53 72 56 63 64 56 76 50 46 73
What is the value of the point estimate of the population mean?
48 53 72 56 63 64 56 76 50 46 73
What is the value of the point estimate of the population mean?
Unlock Deck
Unlock for access to all 62 flashcards in this deck.
Unlock Deck
k this deck
53
A simple random sample of 100 observations was taken from a large population. The sample mean and the standard deviation were determined to be 80 and 12 respectively. Calculate the standard error of the mean.
Unlock Deck
Unlock for access to all 62 flashcards in this deck.
Unlock Deck
k this deck
54
It is impossible to construct a sampling frame for an __________ population
Unlock Deck
Unlock for access to all 62 flashcards in this deck.
Unlock Deck
k this deck
55
Sample statistics, such as , s, or , that provide an estimate of the population parameter are known as
Unlock Deck
Unlock for access to all 62 flashcards in this deck.
Unlock Deck
k this deck
56
As the sample size increases, the standard error of the mean ______________.
Unlock Deck
Unlock for access to all 62 flashcards in this deck.
Unlock Deck
k this deck
57
Random samples of size 100 are taken from an infinite population whose population proportion is 0.2. The mean and standard deviation of the sample proportion are?
Unlock Deck
Unlock for access to all 62 flashcards in this deck.
Unlock Deck
k this deck
58
A random sample of 150 people was taken from a very large population. Ninety of the people in the sample were female. What is the standard error of the proportion?
Unlock Deck
Unlock for access to all 62 flashcards in this deck.
Unlock Deck
k this deck
59
A cellular phone company claims that the mean amount spent per month is more than $75. A test is made of Ho: μ = 75 versus Ha: μ > 75. The null hypothesis is rejected. State the appropriate conclusion.
Unlock Deck
Unlock for access to all 62 flashcards in this deck.
Unlock Deck
k this deck
60
Which statement is NOT true?
A)The greater the level of confidence, the more likely it is that the confidence interval actually includes the true population mean.
B)The greater the level of confidence, the larger the z-score.
C)The greater the level of confidence, the wider the confidence interval.
D)Rejecting the null hypothesis when it is true is a Type II error.
Unlock Deck
Unlock for access to all 62 flashcards in this deck.
Unlock Deck
k this deck
61
In a survey of 3539 female university students ages 18-22, 401 say they live in off-campus housing. If you constructed 90% and 95% confidence intervals for the population proportion how would they differ? As the level of confidence ________________, the confidence interval gets ___________________.
Unlock Deck
Unlock for access to all 62 flashcards in this deck.
Unlock Deck
k this deck
62
What is the difference between the standardized normal distribution (used for tests with z) and the t distribution?
Unlock Deck
Unlock for access to all 62 flashcards in this deck.
Unlock Deck
k this deck
Unlock Deck
Unlock for access to all 62 flashcards in this deck.


