Deck 18: Nonparametric Methods
Full screen (f)
Question
Question
Question
Question
Question
Question
Question
Question
Question
Question
Question
Question
Question
Question
Question
Question
Question
Question
Question
Question
Question
A company advertises that food preparation time can be significantly reduced with the Handy Dandy Slicer. A sample of 12 individuals prepared the ingredients for a meal with and without the slicer. You are given the preparation times (in minutes) below. 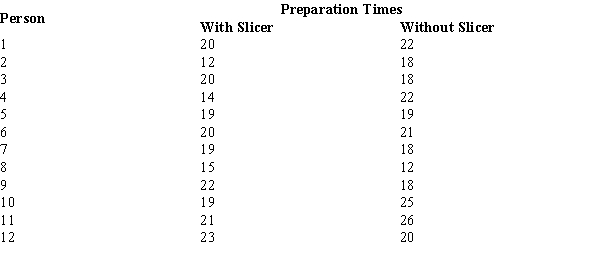 At α = .05, the null hypothesis should
A) be rejected.
B) not be rejected.
C) be revised.
D) not be tested.
At α = .05, the null hypothesis shouldA) be rejected.
B) not be rejected.
C) be revised.
D) not be tested.
Question
Question
A company advertises that food preparation time can be significantly reduced with the Handy Dandy Slicer. A sample of 12 individuals prepared the ingredients for a meal with and without the slicer. You are given the preparation times (in minutes) below.  The p-value for this test is
A) .3133.
B) .2005.
C) .3734.
D) .8167.
The p-value for this test isA) .3133.
B) .2005.
C) .3734.
D) .8167.
Question
Question
Question
A company advertises that food preparation time can be significantly reduced with the Handy Dandy Slicer. A sample of 12 individuals prepared the ingredients for a meal with and without the slicer. You are given the preparation times (in minutes) below.  To test the null hypothesis, the appropriate probability distribution to use is
A) normal.
B) chi-square.
C) t distribution.
D) binomial.
To test the null hypothesis, the appropriate probability distribution to use isA) normal.
B) chi-square.
C) t distribution.
D) binomial.
Question
Question
Question
It has been hypothesized that there is no difference in the mathematical ability of men and women. To test this hypothesis, decision was taken to use the Mann-Whitney-Wilcoxon test. A sample of men and women were given math tests. The scores on the tests are given below.  To test the null hypothesis, the appropriate probability distribution to use is
A) normal.
B) chi-square.
C) t distribution.
D) binomial.
To test the null hypothesis, the appropriate probability distribution to use isA) normal.
B) chi-square.
C) t distribution.
D) binomial.
Question
It has been hypothesized that there is no difference in the mathematical ability of men and women. To test this hypothesis, decision was taken to use the Mann-Whitney-Wilcoxon test. A sample of men and women were given math tests. The scores on the tests are given below.  The null hypothesis is to be tested at the 5% level. The decision rule is to reject the null hypothesis if
A) |z| > 1.96.
B) |t| > 2.08.
C) F > 3.02.
D) χ2 > 5.
The null hypothesis is to be tested at the 5% level. The decision rule is to reject the null hypothesis ifA) |z| > 1.96.
B) |t| > 2.08.
C) F > 3.02.
D) χ2 > 5.
Question
Question
Question
Question
Question
It has been hypothesized that there is no difference in the mathematical ability of men and women. To test this hypothesis, decision was taken to use the Mann-Whitney-Wilcoxon test. A sample of men and women were given math tests. The scores on the tests are given below.  The mean (μW) is
A) 220.
B) 110.
C) 66.
D) 55.
The mean (μW) isA) 220.
B) 110.
C) 66.
D) 55.
Question
A company advertises that food preparation time can be significantly reduced with the Handy Dandy Slicer. A sample of 12 individuals prepared the ingredients for a meal with and without the slicer. You are given the preparation times (in minutes) below.  The test statistic equals
A) -.81 or .81.
B) -.84 or .84.
C) -10 or 10.
D) -20 or 20.
The test statistic equalsA) -.81 or .81.
B) -.84 or .84.
C) -10 or 10.
D) -20 or 20.
Question
Question
Question
Question
It has been hypothesized that there is no difference in the mathematical ability of men and women. To test this hypothesis, decision was taken to use the Mann-Whitney-Wilcoxon test. A sample of men and women were given math tests. The scores on the tests are given below. 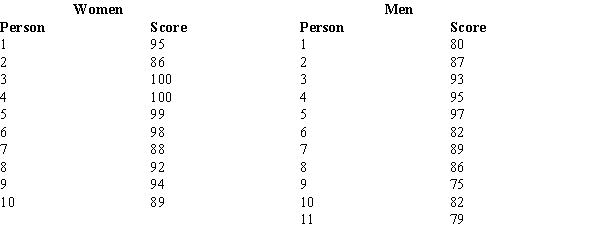 The standard deviation (σW) is
A) 34.8.
B) 11.5.
C) 14.2.
D) 110.
The standard deviation (σW) isA) 34.8.
B) 11.5.
C) 14.2.
D) 110.
Question
Fifteen people were asked to indicate their preference for domestic versus imported cars. The following data showed their preferences. 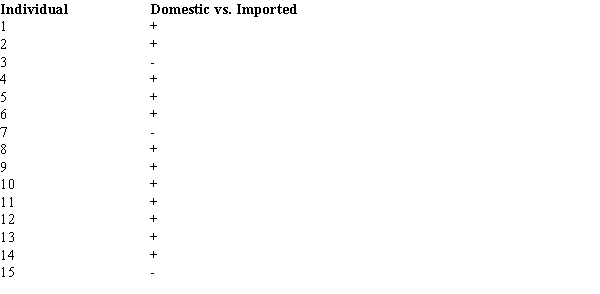
With α = .05, test for a significant difference in the preferences for cars. A "+" indicates a preference for imported cars.
With α = .05, test for a significant difference in the preferences for cars. A "+" indicates a preference for imported cars.
Question
Two employers (A and B) ranked five candidates for a new position based on their eligibility. Their rankings of the candidates are shown below. 
Compute the Spearman rank-correlation coefficient.
Compute the Spearman rank-correlation coefficient.
Question
A clothing manufacturer purchased some newly designed sewing machines in the hopes that production would be increased. The production records (in units/week) of a random sample of workers are shown below. 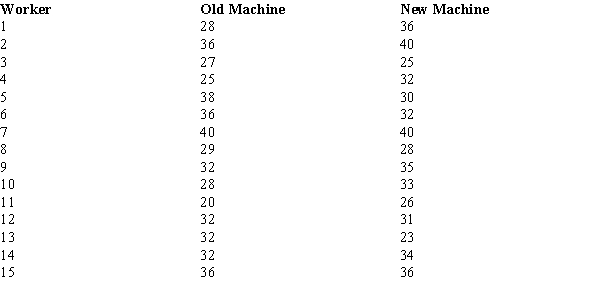
Use the Wilcoxon signed-rank test to determine whether the new machines have significantly increased production. Use a .10 level of significance.
Use the Wilcoxon signed-rank test to determine whether the new machines have significantly increased production. Use a .10 level of significance.
Question
Three universities in your state have decided to administer the same comprehensive examination to the recipients of MBA degrees. From each institution, a random sample of MBA recipients has been selected and given the test. The following table shows the scores of the students from each university.
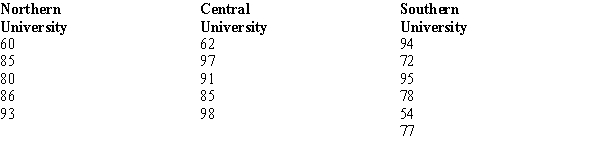
Using the Kruskal-Wallis test to determine the mean ranks for each university sampled.
Using the Kruskal-Wallis test to determine the mean ranks for each university sampled.
Question
Two groups of students were asked to rank the nine activities sponsored by the Student Government Association on campus based on effectiveness. The following table shows their rankings. 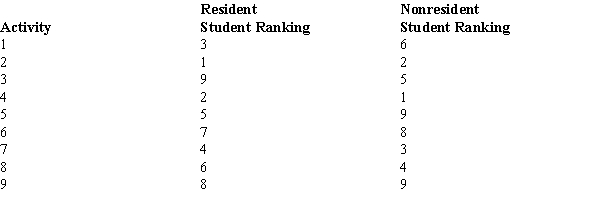
Determine the Spearman rank-correlation coefficient.
Determine the Spearman rank-correlation coefficient.
Question
A comprehensive statistics examination is given to 16 students in order to determine whether or not there is a significant difference in the performance of students majoring in the various disciplines of Business Administration. The following data show the scores of the 17 students (6 majoring in accounting, 6 majoring in management, and 5 majoring in marketing). 
At α = .05, test to see if there is a significant difference in the performance of the students in the three majors.
At α = .05, test to see if there is a significant difference in the performance of the students in the three majors.
Question
Test scores of ten individuals before and after a training program are shown below. 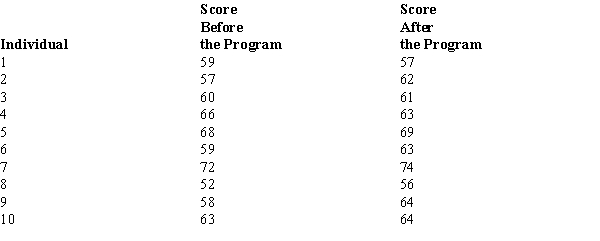
At α = .05, what can be concluded about the effectiveness of the training program?
At α = .05, what can be concluded about the effectiveness of the training program?
Question
Question
Question
Three universities in your state have decided to administer the same comprehensive examination to the recipients of MBA degrees. From each institution, a random sample of MBA recipients has been selected and given the test. The following table shows the scores of the students from each university. 
Use the Kruskal-Wallis test to determine if there is a significant difference in the performance of the students from the three universities. Let α = .05.
Use the Kruskal-Wallis test to determine if there is a significant difference in the performance of the students from the three universities. Let α = .05.
Question
A survey of male and female students at a university showed the following ranking of 13 professors in the management department based on teaching expertise. 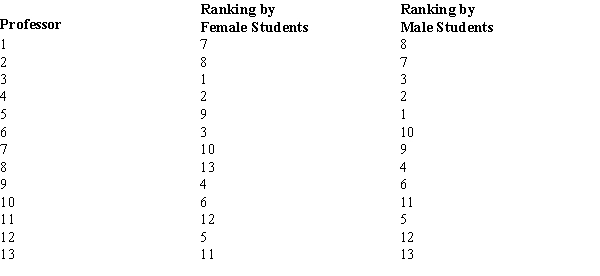
Do the rankings given by the female students agree with the rankings given by the male students at the university level? Use α = .05.
Do the rankings given by the female students agree with the rankings given by the male students at the university level? Use α = .05.
Question
The following data show the preference of 20 people for a candidate to a public office. A "+" indicates a preference for the Democratic candidate, and a "-" indicates a preference for the Republican candidate. 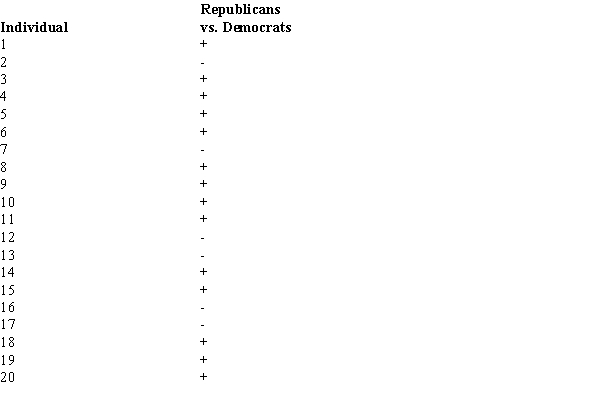
With α = .05, test for a significant difference in the preference for the candidates.
With α = .05, test for a significant difference in the preference for the candidates.
Question
Two faculty members (X and Y) ranked five candidates for scholarships based on performance in sports and after-school activities. The rankings are shown below. 
Compute the Spearman rank-correlation coefficient.
Compute the Spearman rank-correlation coefficient.
Question
Two faculty members ranked 13 candidates for scholarships based on overall academic performance. Calculate the Spearman rank-correlation coefficient and test for the significance of the population rank-correlation coefficient. Use a .02 level of significance. 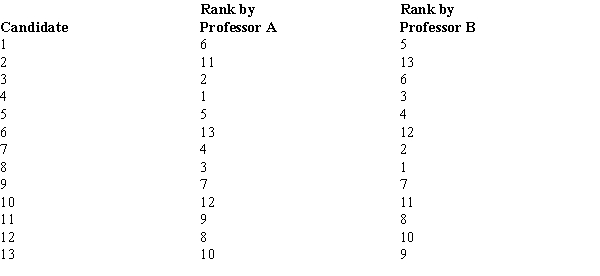
Question
Question
The following data show the test scores of six individuals on a standardized test before and after attending a preparation seminar for the test. 
Use the Wilcoxon signed-rank test in order to determine whether or nor the seminar has been effective. Hint: This is a one tailed test. Let α = .05.
Use the Wilcoxon signed-rank test in order to determine whether or nor the seminar has been effective. Hint: This is a one tailed test. Let α = .05.
Question
Question

Unlock Deck
Sign up to unlock the cards in this deck!
Unlock Deck
Unlock Deck
1/58
Play
Full screen (f)
Deck 18: Nonparametric Methods
1
Statistical methods that generally require very few, if any, assumptions about the population distribution are known as _____ methods.
A) parametric
B) nonparametric
C) free
D) distribution-fixed
A) parametric
B) nonparametric
C) free
D) distribution-fixed
nonparametric
2
The Spearman rank-correlation coefficient for 25 pairs of data when Σdi2 = 50 is
A) .0192.
B) .0376.
C) .9808.
D) .9937.
A) .0192.
B) .0376.
C) .9808.
D) .9937.
.9808.
3
A sign test is a
A) nonparametric method for determining the differences between two populations based on two matched samples using the binomial distribution with p = .2 as the sampling distribution.
B) nonparametric method for determining the differences between two populations based on two matched samples using the binomial distribution with p = .5 as the sampling distribution.
C) nonparametric method for determining the differences between two or more populations based on two or more matched samples using the binomial distribution with p = .2 as the sampling distribution.
D) parametric method for determining the differences between two or more populations based on two or more matched samples using the binomial distribution with p = .5 as the sampling distribution.
nonparametric method for determining the differences between two populations based on two matched samples using the binomial distribution with p = .5 as the sampling distribution.
4
The level of measurement that allows for the rank ordering of categorical data items in nonparametric procedures is _____ measurement.
A) nominal
B) ratio
C) interval
D) ordinal
A) nominal
B) ratio
C) interval
D) ordinal
Unlock Deck
Unlock for access to all 58 flashcards in this deck.
Unlock Deck
k this deck
5
A nonparametric test for the equivalence of two populations would be used instead of a parametric test for the equivalence of the population parameters if
A) the samples are very large.
B) the samples are not independent.
C) no information about the populations is available.
D) the parametric test fails to reject the null hypothesis.
A) the samples are very large.
B) the samples are not independent.
C) no information about the populations is available.
D) the parametric test fails to reject the null hypothesis.
Unlock Deck
Unlock for access to all 58 flashcards in this deck.
Unlock Deck
k this deck
6
Nonparametric methods are statistical methods that
A) require some assumptions about the population.
B) require no assumptions about the population.
C) only deal with small samples.
D) only deal with computations done on categorical data.
A) require some assumptions about the population.
B) require no assumptions about the population.
C) only deal with small samples.
D) only deal with computations done on categorical data.
Unlock Deck
Unlock for access to all 58 flashcards in this deck.
Unlock Deck
k this deck
7
Fifteen people were given two types of cereal, Brand X and Brand Y. Two people preferred Brand X and thirteen people preferred Brand Y. We want to determine whether or not customers prefer one brand over the other. The p-value for this test is
A) .0005.
B) .001.
C) .0037.
D) .0074.
A) .0005.
B) .001.
C) .0037.
D) .0074.
Unlock Deck
Unlock for access to all 58 flashcards in this deck.
Unlock Deck
k this deck
8
A nonparametric version of the parametric analysis of variance test is the _____ test.
A) Kruskal-Wallis
B) Mann-Whitney-Wilcoxon
C) sign
D) Wilcoxon signed-rank
A) Kruskal-Wallis
B) Mann-Whitney-Wilcoxon
C) sign
D) Wilcoxon signed-rank
Unlock Deck
Unlock for access to all 58 flashcards in this deck.
Unlock Deck
k this deck
9
Which of the following tests would not be an example of a nonparametric method?
A) Mann-Whitney-Wilcoxon test
B) Wilcoxon signed-rank test
C) sign test
D) t test
A) Mann-Whitney-Wilcoxon test
B) Wilcoxon signed-rank test
C) sign test
D) t test
Unlock Deck
Unlock for access to all 58 flashcards in this deck.
Unlock Deck
k this deck
10
When ranking the absolute differences in a Wilcoxon signed-rank test, the value of the difference that receives a rank of 1 is the
A) lowest value.
B) highest value.
C) middle value in the data set.
D) average of the highest and the lowest of values.
A) lowest value.
B) highest value.
C) middle value in the data set.
D) average of the highest and the lowest of values.
Unlock Deck
Unlock for access to all 58 flashcards in this deck.
Unlock Deck
k this deck
11
A nonparametric method for determining the differences between two populations based on matched samples where only preference data is required is the _____ test.
A) Mann-Whitney-Wilcoxon
B) Wilcoxon signed-rank
C) sign
D) Kruskal-Wallis
A) Mann-Whitney-Wilcoxon
B) Wilcoxon signed-rank
C) sign
D) Kruskal-Wallis
Unlock Deck
Unlock for access to all 58 flashcards in this deck.
Unlock Deck
k this deck
12
Students in statistics classes were asked whether they preferred a 10-minute break or to allow them go out of class 10 minutes early. In a sample of 150 students, 40 preferred a 10-minute break, 80 preferred going out 10 minutes early, and 30 had no preference. We want to determine if there is a difference in students' preferences. The null hypothesis that is being tested is
A) H0: μ = 150.
B) H0: μ = 75.
C) H0: p = .2.
D) H0: p = .5.
A) H0: μ = 150.
B) H0: μ = 75.
C) H0: p = .2.
D) H0: p = .5.
Unlock Deck
Unlock for access to all 58 flashcards in this deck.
Unlock Deck
k this deck
13
The level of measurement that is simply a label for the purpose of identifying an item which can be used in nonparametric procedures is _____ measurement.
A) ordinal
B) ratio
C) nominal
D) interval
A) ordinal
B) ratio
C) nominal
D) interval
Unlock Deck
Unlock for access to all 58 flashcards in this deck.
Unlock Deck
k this deck
14
Fifteen people were given two types of cereal, Brand X and Brand Y. Two people preferred Brand X and thirteen people preferred Brand Y. We want to determine whether or not customers prefer one brand over the other. To test the null hypothesis, the appropriate probability distribution to use is
A) normal.
B) chi-square.
C) Poisson.
D) binomial.
A) normal.
B) chi-square.
C) Poisson.
D) binomial.
Unlock Deck
Unlock for access to all 58 flashcards in this deck.
Unlock Deck
k this deck
15
The collection of statistical methods that require assumptions about the population is known as _____ methods.
A) distribution-fixed
B) nonparametric
C) populated
D) parametric
A) distribution-fixed
B) nonparametric
C) populated
D) parametric
Unlock Deck
Unlock for access to all 58 flashcards in this deck.
Unlock Deck
k this deck
16
Sixteen people were given two types of cereal, Brand X and Brand Y. Two people preferred Brand X and thirteen people preferred Brand Y. We want to determine whether or not customers prefer one brand over the other. The null hypothesis that is being tested is
A) H0: μ = 8.
B) H0: μ = .5.
C) H0: p = 8.
D) H0: p = .5.
A) H0: μ = 8.
B) H0: μ = .5.
C) H0: p = 8.
D) H0: p = .5.
Unlock Deck
Unlock for access to all 58 flashcards in this deck.
Unlock Deck
k this deck
17
A nonparametric test would be used if
A) categorical data is available.
B) quantitative data is available.
C) it is known that the population is normally distributed.
D) it is easy to transform categorical data to quantitative data.
A) categorical data is available.
B) quantitative data is available.
C) it is known that the population is normally distributed.
D) it is easy to transform categorical data to quantitative data.
Unlock Deck
Unlock for access to all 58 flashcards in this deck.
Unlock Deck
k this deck
18
Fifteen people were given two types of cereal, Brand X and Brand Y. Two people preferred Brand X and thirteen people preferred Brand Y. We want to determine whether or not customers prefer one brand over the other. At α = .01, the null hypothesis should
A) be rejected.
B) not be rejected.
C) be revised.
D) not be tested.
A) be rejected.
B) not be rejected.
C) be revised.
D) not be tested.
Unlock Deck
Unlock for access to all 58 flashcards in this deck.
Unlock Deck
k this deck
19
The Spearman rank-correlation coefficient is a correlation measure based on
A) the average of data items.
B) rank-ordered data for two variables.
C) the median of data items.
D) a linear association between two variables.
A) the average of data items.
B) rank-ordered data for two variables.
C) the median of data items.
D) a linear association between two variables.
Unlock Deck
Unlock for access to all 58 flashcards in this deck.
Unlock Deck
k this deck
20
If a null hypothesis that states that two populations are identical is rejected using a nonparametric test, then it is safe to assume that
A) neither the means nor the variances are equal.
B) the means of the populations are not the same.
C) the variances of the populations are not the same.
D) We cannot be sure of the way in which the populations differ from each other.
A) neither the means nor the variances are equal.
B) the means of the populations are not the same.
C) the variances of the populations are not the same.
D) We cannot be sure of the way in which the populations differ from each other.
Unlock Deck
Unlock for access to all 58 flashcards in this deck.
Unlock Deck
k this deck
21
A company advertises that food preparation time can be significantly reduced with the Handy Dandy Slicer. A sample of 12 individuals prepared the ingredients for a meal with and without the slicer. You are given the preparation times (in minutes) below. At α = .05, the null hypothesis should
A) be rejected.
B) not be rejected.
C) be revised.
D) not be tested.
At α = .05, the null hypothesis shouldA) be rejected.
B) not be rejected.
C) be revised.
D) not be tested.
Unlock Deck
Unlock for access to all 58 flashcards in this deck.
Unlock Deck
k this deck
22
For the Wilcoxon signed-rank test,
A) differences of 0 are discarded.
B) there are no assumptions made about the population distribution.
C) a skewed population is preferred.
D) ties among absolute differences are assigned positive signed ranks.
A) differences of 0 are discarded.
B) there are no assumptions made about the population distribution.
C) a skewed population is preferred.
D) ties among absolute differences are assigned positive signed ranks.
Unlock Deck
Unlock for access to all 58 flashcards in this deck.
Unlock Deck
k this deck
23
A company advertises that food preparation time can be significantly reduced with the Handy Dandy Slicer. A sample of 12 individuals prepared the ingredients for a meal with and without the slicer. You are given the preparation times (in minutes) below. The p-value for this test is
A) .3133.
B) .2005.
C) .3734.
D) .8167.
The p-value for this test isA) .3133.
B) .2005.
C) .3734.
D) .8167.
Unlock Deck
Unlock for access to all 58 flashcards in this deck.
Unlock Deck
k this deck
24
Students in statistics classes were asked whether they preferred a 10-minute break or to allow them go out of class 10 minutes early. In a sample of 150 students, 40 preferred a 10-minute break, 80 preferred going out 10 minutes early, and 30 had no preference. We want to determine if there is a difference in students' preferences. The p-value for testing the hypotheses is
A) less than .002.
B) between .002 and .05.
C) between .05 and .10.
D) greater than .10.
A) less than .002.
B) between .002 and .05.
C) between .05 and .10.
D) greater than .10.
Unlock Deck
Unlock for access to all 58 flashcards in this deck.
Unlock Deck
k this deck
25
Students in statistics classes were asked whether they preferred a 10-minute break or to allow them go out of class 10 minutes early. In a sample of 150 students, 40 preferred a 10-minute break, 80 preferred going out 10 minutes early, and 30 had no preference. We want to determine if there is a difference in students' preferences. The mean and the standard deviation, respectively, of the sampling distribution of the number of students who preferred going out early are
A) 50 and 30.
B) 60 and 30.
C) 50 and 5.477.
D) 60 and 5.477.
A) 50 and 30.
B) 60 and 30.
C) 50 and 5.477.
D) 60 and 5.477.
Unlock Deck
Unlock for access to all 58 flashcards in this deck.
Unlock Deck
k this deck
26
A company advertises that food preparation time can be significantly reduced with the Handy Dandy Slicer. A sample of 12 individuals prepared the ingredients for a meal with and without the slicer. You are given the preparation times (in minutes) below. To test the null hypothesis, the appropriate probability distribution to use is
A) normal.
B) chi-square.
C) t distribution.
D) binomial.
To test the null hypothesis, the appropriate probability distribution to use isA) normal.
B) chi-square.
C) t distribution.
D) binomial.
Unlock Deck
Unlock for access to all 58 flashcards in this deck.
Unlock Deck
k this deck
27
It is believed that the median yearly income in a suburb of Atlanta is $70,000. A sample of 67 residents was taken. Thirty-eight had yearly incomes above $70,000, 26 had yearly incomes below $70,000, and 3 had yearly incomes equal to $70,000. The null hypothesis to be tested is H0: Median = $70,000. The test statistic has a value of
A) 1.63.
B) 1.38.
C) 2.00.
D) 2.50.
A) 1.63.
B) 1.38.
C) 2.00.
D) 2.50.
Unlock Deck
Unlock for access to all 58 flashcards in this deck.
Unlock Deck
k this deck
28
If the assumption can be made that the populations all have the same shape, the Kruskal-Wallis test becomes a test for the
A) skewness of the k populations.
B) variances of the k populations.
C) medians of the k populations.
D) means of the k populations.
A) skewness of the k populations.
B) variances of the k populations.
C) medians of the k populations.
D) means of the k populations.
Unlock Deck
Unlock for access to all 58 flashcards in this deck.
Unlock Deck
k this deck
29
It has been hypothesized that there is no difference in the mathematical ability of men and women. To test this hypothesis, decision was taken to use the Mann-Whitney-Wilcoxon test. A sample of men and women were given math tests. The scores on the tests are given below. To test the null hypothesis, the appropriate probability distribution to use is
A) normal.
B) chi-square.
C) t distribution.
D) binomial.
To test the null hypothesis, the appropriate probability distribution to use isA) normal.
B) chi-square.
C) t distribution.
D) binomial.
Unlock Deck
Unlock for access to all 58 flashcards in this deck.
Unlock Deck
k this deck
30
It has been hypothesized that there is no difference in the mathematical ability of men and women. To test this hypothesis, decision was taken to use the Mann-Whitney-Wilcoxon test. A sample of men and women were given math tests. The scores on the tests are given below. The null hypothesis is to be tested at the 5% level. The decision rule is to reject the null hypothesis if
A) |z| > 1.96.
B) |t| > 2.08.
C) F > 3.02.
D) χ2 > 5.
The null hypothesis is to be tested at the 5% level. The decision rule is to reject the null hypothesis ifA) |z| > 1.96.
B) |t| > 2.08.
C) F > 3.02.
D) χ2 > 5.
Unlock Deck
Unlock for access to all 58 flashcards in this deck.
Unlock Deck
k this deck
31
Students in statistics classes were asked whether they preferred a 10-minute break or to allow them go out of class 10 minutes early. In a sample of 150 students, 40 preferred a 10-minute break, 80 preferred going out 10 minutes early, and 30 had no preference. We want to determine if there is a difference in students' preferences. To test the null hypothesis, the appropriate probability distribution to use is
A) normal.
B) chi-square.
C) t distribution.
D) binomial.
A) normal.
B) chi-square.
C) t distribution.
D) binomial.
Unlock Deck
Unlock for access to all 58 flashcards in this deck.
Unlock Deck
k this deck
32
It is believed that the median yearly income in a suburb of Atlanta is $70,000. A sample of 67 residents was taken. Thirty-eight had yearly incomes above $70,000, 26 had yearly incomes below $70,000, and 3 had yearly incomes equal to $70,000. The null hypothesis to be tested is H0: Median = $70,000. At α = .05, the null hypothesis should
A) be rejected.
B) not be rejected.
C) be revised.
D) not be tested.
A) be rejected.
B) not be rejected.
C) be revised.
D) not be tested.
Unlock Deck
Unlock for access to all 58 flashcards in this deck.
Unlock Deck
k this deck
33
It is believed that the median yearly income in a suburb of Atlanta is $70,000. A sample of 67 residents was taken. Thirty-eight had yearly incomes above $70,000, 26 had yearly incomes below $70,000, and 3 had yearly incomes equal to $70,000. The null hypothesis to be tested is H0: Median = $70,000. To test the null hypothesis, the appropriate probability distribution to use is
A) normal.
B) chi-square.
C) t distribution.
D) binomial.
A) normal.
B) chi-square.
C) t distribution.
D) binomial.
Unlock Deck
Unlock for access to all 58 flashcards in this deck.
Unlock Deck
k this deck
34
It is believed that the median yearly income in a suburb of Atlanta is $70,000. A sample of 67 residents was taken. Thirty-eight had yearly incomes above $70,000, 26 had yearly incomes below $70,000, and 3 had yearly incomes equal to $70,000. The null hypothesis to be tested is H0: Median = $70,000. The p-value for this test is
A) .4332.
B) .8664.
C) .0838.
D) .1676.
A) .4332.
B) .8664.
C) .0838.
D) .1676.
Unlock Deck
Unlock for access to all 58 flashcards in this deck.
Unlock Deck
k this deck
35
It has been hypothesized that there is no difference in the mathematical ability of men and women. To test this hypothesis, decision was taken to use the Mann-Whitney-Wilcoxon test. A sample of men and women were given math tests. The scores on the tests are given below. The mean (μW) is
A) 220.
B) 110.
C) 66.
D) 55.
The mean (μW) isA) 220.
B) 110.
C) 66.
D) 55.
Unlock Deck
Unlock for access to all 58 flashcards in this deck.
Unlock Deck
k this deck
36
A company advertises that food preparation time can be significantly reduced with the Handy Dandy Slicer. A sample of 12 individuals prepared the ingredients for a meal with and without the slicer. You are given the preparation times (in minutes) below. The test statistic equals
A) -.81 or .81.
B) -.84 or .84.
C) -10 or 10.
D) -20 or 20.
The test statistic equalsA) -.81 or .81.
B) -.84 or .84.
C) -10 or 10.
D) -20 or 20.
Unlock Deck
Unlock for access to all 58 flashcards in this deck.
Unlock Deck
k this deck
37
It is believed that the median yearly income in a suburb of Atlanta is $70,000. A sample of 67 residents was taken. Thirty-eight had yearly incomes above $70,000, 26 had yearly incomes below $70,000, and 3 had yearly incomes equal to $70,000. The null hypothesis to be tested is H0: Median = $70,000. The mean and the standard deviation (respectively) for this test about the median are
A) 32 and 4.
B) 32 and 16.
C) 33.5 and 4.
D) 33.5 and 16.
A) 32 and 4.
B) 32 and 16.
C) 33.5 and 4.
D) 33.5 and 16.
Unlock Deck
Unlock for access to all 58 flashcards in this deck.
Unlock Deck
k this deck
38
Students in statistics classes were asked whether they preferred a 10-minute break or to allow them go out of class 10 minutes early. In a sample of 150 students, 40 preferred a 10-minute break, 80 preferred going out 10 minutes early, and 30 had no preference. We want to determine if there is a difference in students' preferences. At the 1% level of significance, the null hypothesis should
A) be rejected.
B) not be rejected.
C) be revised.
D) not be tested.
A) be rejected.
B) not be rejected.
C) be revised.
D) not be tested.
Unlock Deck
Unlock for access to all 58 flashcards in this deck.
Unlock Deck
k this deck
39
Students in statistics classes were asked whether they preferred a 10-minute break or to allow them go out of class 10 minutes early. In a sample of 150 students, 40 preferred a 10-minute break, 80 preferred going out 10 minutes early, and 30 had no preference. We want to determine if there is a difference in students' preferences. The test statistic based on the number of students who preferred going out early equals (Use the continuity correction factor.)
A) 1.83.
B) .67.
C) .82.
D) 3.56.
A) 1.83.
B) .67.
C) .82.
D) 3.56.
Unlock Deck
Unlock for access to all 58 flashcards in this deck.
Unlock Deck
k this deck
40
It has been hypothesized that there is no difference in the mathematical ability of men and women. To test this hypothesis, decision was taken to use the Mann-Whitney-Wilcoxon test. A sample of men and women were given math tests. The scores on the tests are given below. The standard deviation (σW) is
A) 34.8.
B) 11.5.
C) 14.2.
D) 110.
The standard deviation (σW) isA) 34.8.
B) 11.5.
C) 14.2.
D) 110.
Unlock Deck
Unlock for access to all 58 flashcards in this deck.
Unlock Deck
k this deck
41
Fifteen people were asked to indicate their preference for domestic versus imported cars. The following data showed their preferences.
With α = .05, test for a significant difference in the preferences for cars. A "+" indicates a preference for imported cars.
With α = .05, test for a significant difference in the preferences for cars. A "+" indicates a preference for imported cars.
Unlock Deck
Unlock for access to all 58 flashcards in this deck.
Unlock Deck
k this deck
42
Two employers (A and B) ranked five candidates for a new position based on their eligibility. Their rankings of the candidates are shown below.
Compute the Spearman rank-correlation coefficient.
Compute the Spearman rank-correlation coefficient.
Unlock Deck
Unlock for access to all 58 flashcards in this deck.
Unlock Deck
k this deck
43
A clothing manufacturer purchased some newly designed sewing machines in the hopes that production would be increased. The production records (in units/week) of a random sample of workers are shown below.
Use the Wilcoxon signed-rank test to determine whether the new machines have significantly increased production. Use a .10 level of significance.
Use the Wilcoxon signed-rank test to determine whether the new machines have significantly increased production. Use a .10 level of significance.
Unlock Deck
Unlock for access to all 58 flashcards in this deck.
Unlock Deck
k this deck
44
Three universities in your state have decided to administer the same comprehensive examination to the recipients of MBA degrees. From each institution, a random sample of MBA recipients has been selected and given the test. The following table shows the scores of the students from each university.
Using the Kruskal-Wallis test to determine the mean ranks for each university sampled.
Using the Kruskal-Wallis test to determine the mean ranks for each university sampled.
Unlock Deck
Unlock for access to all 58 flashcards in this deck.
Unlock Deck
k this deck
45
Two groups of students were asked to rank the nine activities sponsored by the Student Government Association on campus based on effectiveness. The following table shows their rankings.
Determine the Spearman rank-correlation coefficient.
Determine the Spearman rank-correlation coefficient.
Unlock Deck
Unlock for access to all 58 flashcards in this deck.
Unlock Deck
k this deck
46
A comprehensive statistics examination is given to 16 students in order to determine whether or not there is a significant difference in the performance of students majoring in the various disciplines of Business Administration. The following data show the scores of the 17 students (6 majoring in accounting, 6 majoring in management, and 5 majoring in marketing).
At α = .05, test to see if there is a significant difference in the performance of the students in the three majors.
At α = .05, test to see if there is a significant difference in the performance of the students in the three majors.
Unlock Deck
Unlock for access to all 58 flashcards in this deck.
Unlock Deck
k this deck
47
Test scores of ten individuals before and after a training program are shown below.
At α = .05, what can be concluded about the effectiveness of the training program?
At α = .05, what can be concluded about the effectiveness of the training program?
Unlock Deck
Unlock for access to all 58 flashcards in this deck.
Unlock Deck
k this deck
48
When using the Kruskall-Wallis Test for nonparametric methods, if each sample is at least five, then you can use the _____ distribution for your approximation.
A) normal
B) chi-square
C) t
D) binomial
A) normal
B) chi-square
C) t
D) binomial
Unlock Deck
Unlock for access to all 58 flashcards in this deck.
Unlock Deck
k this deck
49
From the courthouse records, it is found that in 60 divorce cases, the filing for divorce was initiated by the wife 41 times. Using the sign test, test for a difference in filing between husbands and wives. Let α = .05. Hint: Use the continuity correction factor.
Unlock Deck
Unlock for access to all 58 flashcards in this deck.
Unlock Deck
k this deck
50
Three universities in your state have decided to administer the same comprehensive examination to the recipients of MBA degrees. From each institution, a random sample of MBA recipients has been selected and given the test. The following table shows the scores of the students from each university.
Use the Kruskal-Wallis test to determine if there is a significant difference in the performance of the students from the three universities. Let α = .05.
Use the Kruskal-Wallis test to determine if there is a significant difference in the performance of the students from the three universities. Let α = .05.
Unlock Deck
Unlock for access to all 58 flashcards in this deck.
Unlock Deck
k this deck
51
A survey of male and female students at a university showed the following ranking of 13 professors in the management department based on teaching expertise.
Do the rankings given by the female students agree with the rankings given by the male students at the university level? Use α = .05.
Do the rankings given by the female students agree with the rankings given by the male students at the university level? Use α = .05.
Unlock Deck
Unlock for access to all 58 flashcards in this deck.
Unlock Deck
k this deck
52
The following data show the preference of 20 people for a candidate to a public office. A "+" indicates a preference for the Democratic candidate, and a "-" indicates a preference for the Republican candidate.
With α = .05, test for a significant difference in the preference for the candidates.
With α = .05, test for a significant difference in the preference for the candidates.
Unlock Deck
Unlock for access to all 58 flashcards in this deck.
Unlock Deck
k this deck
53
Two faculty members (X and Y) ranked five candidates for scholarships based on performance in sports and after-school activities. The rankings are shown below.
Compute the Spearman rank-correlation coefficient.
Compute the Spearman rank-correlation coefficient.
Unlock Deck
Unlock for access to all 58 flashcards in this deck.
Unlock Deck
k this deck
54
Two faculty members ranked 13 candidates for scholarships based on overall academic performance. Calculate the Spearman rank-correlation coefficient and test for the significance of the population rank-correlation coefficient. Use a .02 level of significance.
Unlock Deck
Unlock for access to all 58 flashcards in this deck.
Unlock Deck
k this deck
55
In a sample of 120 people, 50 indicated that they prefer domestic automobiles, 60 said they prefer foreign-made cars, and 10 indicated no difference in their preference. At a .05 level of significance, determine if there is evidence of a significant difference in the preferences for the two makes of automobiles. Hint: Use the continuity correction factor.
Unlock Deck
Unlock for access to all 58 flashcards in this deck.
Unlock Deck
k this deck
56
The following data show the test scores of six individuals on a standardized test before and after attending a preparation seminar for the test.
Use the Wilcoxon signed-rank test in order to determine whether or nor the seminar has been effective. Hint: This is a one tailed test. Let α = .05.
Use the Wilcoxon signed-rank test in order to determine whether or nor the seminar has been effective. Hint: This is a one tailed test. Let α = .05.
Unlock Deck
Unlock for access to all 58 flashcards in this deck.
Unlock Deck
k this deck
57
Nonparametric methods which can be used to make inferences about a population without requiring an assumption about the distribution of the population are also called
A) continuity-correction methods.
B) non-probabilistic methods.
C) distribution-free methods.
D) non-quantitative methods.
A) continuity-correction methods.
B) non-probabilistic methods.
C) distribution-free methods.
D) non-quantitative methods.
Unlock Deck
Unlock for access to all 58 flashcards in this deck.
Unlock Deck
k this deck
58
For the Wilcoxon signed-rank test, ties among absolute differences are assigned the
A) lowest of their ranks.
B) average of their ranks.
C) highest of their ranks.
D) sum of their ranks.
A) lowest of their ranks.
B) average of their ranks.
C) highest of their ranks.
D) sum of their ranks.
Unlock Deck
Unlock for access to all 58 flashcards in this deck.
Unlock Deck
k this deck
Unlock Deck
Unlock for access to all 58 flashcards in this deck.


