Deck 11: Spreadsheet Modeling and Analysis
Full screen (f)
Question
Question
Question
Question
Question
Question
Question
Question
Question
Question
Question
Question
Question
Question
Question
Question
Question
Question
Question
Question
Question
Question
Question
Question
Question
Question
Question
Question
Question
Question
Question
Question
Question
Question
Question
Question
Question
Question
Question
Question
Question
Question
Blue Sunset Band is planning to record a new album. A major decision to be made is if the band can record the album on their own, or if they should hire a studio to record it with. The fixed cost for recording at the studio is $100,000, plus the manufacturing cost per CD, which is at $5. If they record the album in-house, the cost per CD is $10. They plan to produce 3000 copies of the album regardless of the place of recording. If the band wished to break even with the cost, how can they achieve this by using the Goal Seek feature in Excel? 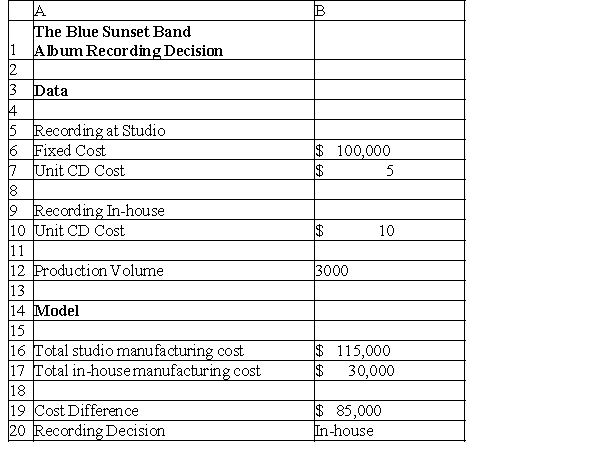
Question
Question
Question
Question
Question
Question
Question
Question
Question
Question
Question
Question
Question
Question
Question
Question
Question
Question
Question
Question
Question
Question
Question
Question
Question

Unlock Deck
Sign up to unlock the cards in this deck!
Unlock Deck
Unlock Deck
1/67
Play
Full screen (f)
Deck 11: Spreadsheet Modeling and Analysis
1
In which of the following ways does demand influence profit?
A) It predicts how many units will be sold.
B) It directly influences the fixed cost of production.
C) It helps in reducing the variable cost of production.
D) It reduces the unit cost of production.
A) It predicts how many units will be sold.
B) It directly influences the fixed cost of production.
C) It helps in reducing the variable cost of production.
D) It reduces the unit cost of production.
A
2
Use the table below to answer the following question(s).
Dresden Pharmaceuticals has decided to go ahead and start clinical trials on a potential new drug. The total R&D costs are estimated to reach around $875,000,000 with clinical trials mounting to
$145,000,000. The current market size is estimated to be around 3,000,000 and is expected to grow at 4 percent every year. The market share Dresden hopes to capture in the first year is 7 percent, and is projected to grow by 25 percent each year for the next 4 years. A monthly prescription is anticipated to generate revenue of $420 while incurring variable costs of $150. A discount rate of 8 percent is assumed.
-Calculate the projected sales for the first year.
A) 273,000
B) 210,000
C) 378,000,000
D) 268,230
210,000
3
In the equation to calculate the economic value of a customer, V = R × F × M / D, how is the value for F estimated?
A) It is estimated to be the total number of purchases the customer has made.
B) It is estimated to be the number of visits of the customer without actually spending on an item.
C) It is estimated to be the purchase frequency per year.
D) It is estimated to be the number of customers defecting per year.
C
4
Which of the following formulas are used to calculate the In-house recording cost?
A) B10*B12
B) B10*B12-B17
C) B6+B10*B12
D) =SUM(B6:B12)-B7
A) B10*B12
B) B10*B12-B17
C) B6+B10*B12
D) =SUM(B6:B12)-B7
Unlock Deck
Unlock for access to all 67 flashcards in this deck.
Unlock Deck
k this deck
5
Use the table below to answer the following question(s).
Dresden Pharmaceuticals has decided to go ahead and start clinical trials on a potential new drug. The total R&D costs are estimated to reach around $875,000,000 with clinical trials mounting to
$145,000,000. The current market size is estimated to be around 3,000,000 and is expected to grow at 4 percent every year. The market share Dresden hopes to capture in the first year is 7 percent, and is projected to grow by 25 percent each year for the next 4 years. A monthly prescription is anticipated to generate revenue of $420 while incurring variable costs of $150. A discount rate of 8 percent is assumed.
-Calculate the market size for the second year.
A) 3,000,000
B) 273,000
C) 3,244,800
D) 3,120,000
Unlock Deck
Unlock for access to all 67 flashcards in this deck.
Unlock Deck
k this deck
6
Use a modern software tool to perform statistical calculations. Using the spreadsheet below to answer the following question(s).
The spreadsheet below shows the net income model for a company that sells shoes.
-Which of the following formulas would be used to calculate the net income value using only the information in the Model, and not in the Data section?
A) =B5-B17
B) =B6-B15
C) =B15-B16-B17+B18
D) =B18-B11
The spreadsheet below shows the net income model for a company that sells shoes.
-Which of the following formulas would be used to calculate the net income value using only the information in the Model, and not in the Data section?
A) =B5-B17
B) =B6-B15
C) =B15-B16-B17+B18
D) =B18-B11
Unlock Deck
Unlock for access to all 67 flashcards in this deck.
Unlock Deck
k this deck
7
Use a modern software tool to perform statistical calculations.
Use the table below to answer the following question(s).
Below is the profit model spreadsheet for the Lazarus Shoe Company producing their latest model of shoes for the month of January.
-Calculate the revenue for units sold.
A) $836,000
B) $1,136,000
C) $600,000
D) $1,786,000
Use the table below to answer the following question(s).
Below is the profit model spreadsheet for the Lazarus Shoe Company producing their latest model of shoes for the month of January.
-Calculate the revenue for units sold.
A) $836,000
B) $1,136,000
C) $600,000
D) $1,786,000
Unlock Deck
Unlock for access to all 67 flashcards in this deck.
Unlock Deck
k this deck
8
Use a modern software tool to perform statistical calculations. Using the spreadsheet below to answer the following question(s).
The spreadsheet below shows the net income model for a company that sells shoes.
-Which of the following formulas would be used to calculate the net operating income?
A) =B15-B5
B) =B15-B16
C) =SUM(B6:B10)-B11
D) =B15-B16+B6
The spreadsheet below shows the net income model for a company that sells shoes.
-Which of the following formulas would be used to calculate the net operating income?
A) =B15-B5
B) =B15-B16
C) =SUM(B6:B10)-B11
D) =B15-B16+B6
Unlock Deck
Unlock for access to all 67 flashcards in this deck.
Unlock Deck
k this deck
9
Use a modern software tool to perform statistical calculations.
Use the table below to answer the following question(s).
Below is the profit model spreadsheet for the Lazarus Shoe Company producing their latest model of shoes for the month of January.
-Calculate the total profit.
A) $600,000
B) $1,436,000
C) $836,000
D) $1,786,000
Use the table below to answer the following question(s).
Below is the profit model spreadsheet for the Lazarus Shoe Company producing their latest model of shoes for the month of January.
-Calculate the total profit.
A) $600,000
B) $1,436,000
C) $836,000
D) $1,786,000
Unlock Deck
Unlock for access to all 67 flashcards in this deck.
Unlock Deck
k this deck
10
Use the table below to answer the following question(s).
Dresden Pharmaceuticals has decided to go ahead and start clinical trials on a potential new drug. The total R&D costs are estimated to reach around $875,000,000 with clinical trials mounting to
$145,000,000. The current market size is estimated to be around 3,000,000 and is expected to grow at 4 percent every year. The market share Dresden hopes to capture in the first year is 7 percent, and is projected to grow by 25 percent each year for the next 4 years. A monthly prescription is anticipated to generate revenue of $420 while incurring variable costs of $150. A discount rate of 8 percent is assumed.
-Calculate the market share percentage in the third year.
A) 25 percent
B) 4 percent
C) 11 percent
D) 7 percent
Unlock Deck
Unlock for access to all 67 flashcards in this deck.
Unlock Deck
k this deck
11
Use a modern software tool to perform statistical calculations. Using the spreadsheet below to answer the following question(s).
The spreadsheet below shows the net income model for a company that sells shoes.
-Which of the following formulas would be used to calculate earnings before taxes?
A) =B15-B16+B6
B) =B15-B5
C) =B15-B16
D) =B17-B10
The spreadsheet below shows the net income model for a company that sells shoes.
-Which of the following formulas would be used to calculate earnings before taxes?
A) =B15-B16+B6
B) =B15-B5
C) =B15-B16
D) =B17-B10
Unlock Deck
Unlock for access to all 67 flashcards in this deck.
Unlock Deck
k this deck
12
Use a modern software tool to perform statistical calculations.
Use the table below to answer the following question(s).
Below is the profit model spreadsheet for the Lazarus Shoe Company producing their latest model of shoes for the month of January.
-Calculate the variable cost of production.
A) $1,786,000
B) $836,000
C) $600,000
D) $1,436,000
Use the table below to answer the following question(s).
Below is the profit model spreadsheet for the Lazarus Shoe Company producing their latest model of shoes for the month of January.
-Calculate the variable cost of production.
A) $1,786,000
B) $836,000
C) $600,000
D) $1,436,000
Unlock Deck
Unlock for access to all 67 flashcards in this deck.
Unlock Deck
k this deck
13
Use the table below to answer the following question(s).
Dresden Pharmaceuticals has decided to go ahead and start clinical trials on a potential new drug. The total R&D costs are estimated to reach around $875,000,000 with clinical trials mounting to
$145,000,000. The current market size is estimated to be around 3,000,000 and is expected to grow at 4 percent every year. The market share Dresden hopes to capture in the first year is 7 percent, and is projected to grow by 25 percent each year for the next 4 years. A monthly prescription is anticipated to generate revenue of $420 while incurring variable costs of $150. A discount rate of 8 percent is assumed.
-Calculate the annual revenue for the fourth year.
A) $ 2,325,304,800
B) $830,466,000
C) $1,494,838,800
D) $1,149,876,000
Unlock Deck
Unlock for access to all 67 flashcards in this deck.
Unlock Deck
k this deck
14
Use a modern software tool to perform statistical calculations. Using the spreadsheet below to answer the following question(s).
The spreadsheet below shows the net income model for a company that sells shoes.
-Which of the following formulas would be used to calculate the net income value using only the data value?
A) =SUM(B5:B10)-B11
B) =SUM(B5:B11)
C) =B5-SUM(B6:B11)
D) =B5-SUM(B6:B10)+B11
The spreadsheet below shows the net income model for a company that sells shoes.
-Which of the following formulas would be used to calculate the net income value using only the data value?
A) =SUM(B5:B10)-B11
B) =SUM(B5:B11)
C) =B5-SUM(B6:B11)
D) =B5-SUM(B6:B10)+B11
Unlock Deck
Unlock for access to all 67 flashcards in this deck.
Unlock Deck
k this deck
15
Use a modern software tool to perform statistical calculations. Using the spreadsheet below to answer the following question(s).
The spreadsheet below shows the net income model for a company that sells shoes.
-Which of the following formulas would be used to calculate the operating expenses?
A) =SUM(B7:B10)
B) =SUM(B7:B9)
C) =SUM(B7:B9)-B6
D) =SUM(B7:10)-B11
The spreadsheet below shows the net income model for a company that sells shoes.
-Which of the following formulas would be used to calculate the operating expenses?
A) =SUM(B7:B10)
B) =SUM(B7:B9)
C) =SUM(B7:B9)-B6
D) =SUM(B7:10)-B11
Unlock Deck
Unlock for access to all 67 flashcards in this deck.
Unlock Deck
k this deck
16
Which of the following formulas is used to calculate the total studio recording cost?
A) =SUM(B6:B12)-B10
B) (B6+B7-B16)B12
C) B6+B7*B12
D) B6+B7*B12-B16
A) =SUM(B6:B12)-B10
B) (B6+B7-B16)B12
C) B6+B7*B12
D) B6+B7*B12-B16
Unlock Deck
Unlock for access to all 67 flashcards in this deck.
Unlock Deck
k this deck
17
Troista Mobile Accessories sells mobile apps on their Web site. If a customer spends on average, $12 per visit and visits the Web site 20 times each year, what is the average nondiscounted gross profit during a customer's lifetime? Given that Troista makes a margin of 60 percent on the average bill, with 25 percent of customers not returning each year.
A) $30
B) $75
C) $360
D) $576
A) $30
B) $75
C) $360
D) $576
Unlock Deck
Unlock for access to all 67 flashcards in this deck.
Unlock Deck
k this deck
18
Use a modern software tool to perform statistical calculations. Using the spreadsheet below to answer the following question(s).
The spreadsheet below shows the net income model for a company that sells shoes.
-Which of the following would be used to calculate the gross profit?
A) =SUM(B7:B11)-B6
B) =B5-B6
C) =B5-(B6-B11)
D) =B5-B6+(B11-B10)
The spreadsheet below shows the net income model for a company that sells shoes.
-Which of the following would be used to calculate the gross profit?
A) =SUM(B7:B11)-B6
B) =B5-B6
C) =B5-(B6-B11)
D) =B5-B6+(B11-B10)
Unlock Deck
Unlock for access to all 67 flashcards in this deck.
Unlock Deck
k this deck
19
Which of the following is necessary to calculate the variable cost of production for the company to develop a profit model?
A) unit sale price
B) quantity of item produced
C) quantity of item sold
D) fixed cost of production
A) unit sale price
B) quantity of item produced
C) quantity of item sold
D) fixed cost of production
Unlock Deck
Unlock for access to all 67 flashcards in this deck.
Unlock Deck
k this deck
20
Which of the following formula is used to make the recording decision in B20?
A) =IF(B19>0,"In-house","Studio")
B) =IF(B19<=0,"Studio","In-house")
C) =SUM(B19<=0,"Studio")
D) =IF(B19>0,"Studio","In-house")
A) =IF(B19>0,"In-house","Studio")
B) =IF(B19<=0,"Studio","In-house")
C) =SUM(B19<=0,"Studio")
D) =IF(B19>0,"Studio","In-house")
Unlock Deck
Unlock for access to all 67 flashcards in this deck.
Unlock Deck
k this deck
21
Which of the following is the root cause for the newsvendor problem?
A) uncertainty in supply
B) uncertainty in demand
C) high cost per unit sale
D) high total production cost
A) uncertainty in supply
B) uncertainty in demand
C) high cost per unit sale
D) high total production cost
Unlock Deck
Unlock for access to all 67 flashcards in this deck.
Unlock Deck
k this deck
22
Identify different business uses for statistics and the major statistical tools businesses use
Use the table below to answer the following question(s).
Sujito Electronix makes headphones for $22 and sells them for $32. Sujito has sold at least 50 headphones on average per week in the past, though the actual demand is unknown. Sujito has also often run short of supply in the past. After three months of release, the headphones are sold at 40 percent discount. The spreadsheet below shows Sujito's sales and demand for the headphones. We take demand at 51, and quantity produced at 55.
-Calculate the net profit for the headphones.
A) $586.8
B) $498.8
C) $1653.8
D) $466.8
Unlock Deck
Unlock for access to all 67 flashcards in this deck.
Unlock Deck
k this deck
23
Use a modern software tool to perform statistical calculations.
Use the table below to answer the following question(s).
Fiberia Accessories, a clothing retailer, is planning to introduce a new line of sweaters as part of the winter collection for $65 with an inventory of 1500. The main selling season is 60 days between November and December. The store then sells the remaining units in a clearance sale at 65 percent discount. Out of the 60 main retail days, Fiberia sells the sweaters at full retail price for only 45 days, while giving a discount of 25 percent for the remaining 15 days. The demand functions a, and b are given as 79.5 and 1.1 respectively.
-Calculate the daily sales during the discount sales period.
A) 39.28
B) 133.3
C) 388.13
D) 25.88
Unlock Deck
Unlock for access to all 67 flashcards in this deck.
Unlock Deck
k this deck
24
Use the table below to answer the following question(s).
Dresden Pharmaceuticals has decided to go ahead and start clinical trials on a potential new drug. The total R&D costs are estimated to reach around $875,000,000 with clinical trials mounting to
$145,000,000. The current market size is estimated to be around 3,000,000 and is expected to grow at 4 percent every year. The market share Dresden hopes to capture in the first year is 7 percent, and is projected to grow by 25 percent each year for the next 4 years. A monthly prescription is anticipated to generate revenue of $420 while incurring variable costs of $150. A discount rate of 8 percent is assumed.
-Calculate the net present value for Dresden's new drug.
A) $1,312,041,240
B) ($339,600,000)
C) $3,702,463,939
D) ($932,028,690)
Unlock Deck
Unlock for access to all 67 flashcards in this deck.
Unlock Deck
k this deck
25
Use a modern software tool to perform statistical calculations.
Use the table below to answer the following question(s).
Fiberia Accessories, a clothing retailer, is planning to introduce a new line of sweaters as part of the winter collection for $65 with an inventory of 1500. The main selling season is 60 days between November and December. The store then sells the remaining units in a clearance sale at 65 percent discount. Out of the 60 main retail days, Fiberia sells the sweaters at full retail price for only 45 days, while giving a discount of 25 percent for the remaining 15 days. The demand functions a, and b are given as 79.5 and 1.1 respectively.
-What is the average daily sale during the full retail sales period?
A) 15
B) 33.33
C) 8
D) 24.55
Unlock Deck
Unlock for access to all 67 flashcards in this deck.
Unlock Deck
k this deck
26
Use a modern software tool to perform statistical calculations.
Use the table below to answer the following question(s).
Fiberia Accessories, a clothing retailer, is planning to introduce a new line of sweaters as part of the winter collection for $65 with an inventory of 1500. The main selling season is 60 days between November and December. The store then sells the remaining units in a clearance sale at 65 percent discount. Out of the 60 main retail days, Fiberia sells the sweaters at full retail price for only 45 days, while giving a discount of 25 percent for the remaining 15 days. The demand functions a, and b are given as 79.5 and 1.1 respectively.
-Calculate the total number of units sold during the full retail sales period.
A) 33.33
B) 520
C) 187.5
D) 360
Unlock Deck
Unlock for access to all 67 flashcards in this deck.
Unlock Deck
k this deck
27
Use the table below to answer the following question(s).
Below is a room overbooking model spreadsheet for the Metza, a hotel chain. The hotel has 425 rooms priced at $180 per day each, and is usually fully booked. Reservations can be cancelled any time before 5:00 p.m. with no penalty. The hotel estimates an average overbooking cost of
$150. Customer demand is set at 400 with an average cancellation of 20.
-Which of the following is the excel formula used to estimate overbooked customers?
A) =MIN(0,B5-B15)
B) =MAX(0,B15-B5)
C) =MAX(B11,B12)
D) =MIN(B11-B12,B11-B14)
Unlock Deck
Unlock for access to all 67 flashcards in this deck.
Unlock Deck
k this deck
28
Use the table below to answer the following question(s).
Sheila joined Simsin Tradings at the age of 36 with a starting salary of $75,000. She expects a salary increase of 5 percent every year. Her retirement plan requires her to pay 9 percent of her salary, while the company matches it at 32 percent. She expects an annual return of 7 percent on her retirement portfolio. Using a predictive model for Sheila's first five years, calculate the following, assuming that the salary increases at the same rate every year, and the return of interest does not change.
-What will be the amount of employee contribution to retirement plan when Sheila has reached the age of 38?
A) $7,441.88
B) $7,813.97
C) $24,450
D) $2381.40
Unlock Deck
Unlock for access to all 67 flashcards in this deck.
Unlock Deck
k this deck
29
Use the table below to answer the following question(s).
Below is a room overbooking model spreadsheet for the Metza, a hotel chain. The hotel has 425 rooms priced at $180 per day each, and is usually fully booked. Reservations can be cancelled any time before 5:00 p.m. with no penalty. The hotel estimates an average overbooking cost of
$150. Customer demand is set at 400 with an average cancellation of 20.
-Calculate the customer arrivals at the Metza.
A) 425
B) 405
C) 400
D) 380
Unlock Deck
Unlock for access to all 67 flashcards in this deck.
Unlock Deck
k this deck
30
Which of the following conditions is the optimal solution to the newsvendor problem, where Q is the quantity to be purchased, and D is demand?
A) Q > D
B) Q = D
C) D > Q
D) Q / D = 0
A) Q > D
B) Q = D
C) D > Q
D) Q / D = 0
Unlock Deck
Unlock for access to all 67 flashcards in this deck.
Unlock Deck
k this deck
31
Use the table below to answer the following question(s).
Sheila joined Simsin Tradings at the age of 36 with a starting salary of $75,000. She expects a salary increase of 5 percent every year. Her retirement plan requires her to pay 9 percent of her salary, while the company matches it at 32 percent. She expects an annual return of 7 percent on her retirement portfolio. Using a predictive model for Sheila's first five years, calculate the following, assuming that the salary increases at the same rate every year, and the return of interest does not change.
-What's the total retirement balance when Sheila has reached the age of 40 while working with Simsin?
A) $108,374.54
B) $56,253.36
C) $53,627.87
D) $91,163
Unlock Deck
Unlock for access to all 67 flashcards in this deck.
Unlock Deck
k this deck
32
Use the table below to answer the following question(s).
Dresden Pharmaceuticals has decided to go ahead and start clinical trials on a potential new drug. The total R&D costs are estimated to reach around $875,000,000 with clinical trials mounting to
$145,000,000. The current market size is estimated to be around 3,000,000 and is expected to grow at 4 percent every year. The market share Dresden hopes to capture in the first year is 7 percent, and is projected to grow by 25 percent each year for the next 4 years. A monthly prescription is anticipated to generate revenue of $420 while incurring variable costs of $150. A discount rate of 8 percent is assumed.
-Calculate cumulative net profit at the fourth year.
A) $1,073,538,462
B) $3,189,634,800
C) $1,312,041,240
D) $1,494,838,800
Unlock Deck
Unlock for access to all 67 flashcards in this deck.
Unlock Deck
k this deck
33
Use the table below to answer the following question(s).
Sheila joined Simsin Tradings at the age of 36 with a starting salary of $75,000. She expects a salary increase of 5 percent every year. Her retirement plan requires her to pay 9 percent of her salary, while the company matches it at 32 percent. She expects an annual return of 7 percent on her retirement portfolio. Using a predictive model for Sheila's first five years, calculate the following, assuming that the salary increases at the same rate every year, and the return of interest does not change.
-Calculate the employer contribution in Sheila's fourth year at Simsin.
A) $546.98
B) $703.26
C) $2,500.47
D) $2,160
Unlock Deck
Unlock for access to all 67 flashcards in this deck.
Unlock Deck
k this deck
34
Use the table below to answer the following question(s).
Dresden Pharmaceuticals has decided to go ahead and start clinical trials on a potential new drug. The total R&D costs are estimated to reach around $875,000,000 with clinical trials mounting to
$145,000,000. The current market size is estimated to be around 3,000,000 and is expected to grow at 4 percent every year. The market share Dresden hopes to capture in the first year is 7 percent, and is projected to grow by 25 percent each year for the next 4 years. A monthly prescription is anticipated to generate revenue of $420 while incurring variable costs of $150. A discount rate of 8 percent is assumed.
-Calculate the projected profit for the third year.
A) $31,315,200
B) $2,373,996,000
C) $1,149,876,000
D) $1,494,838,800
Unlock Deck
Unlock for access to all 67 flashcards in this deck.
Unlock Deck
k this deck
35
Use a modern software tool to perform statistical calculations.
Use the table below to answer the following question(s).
Fiberia Accessories, a clothing retailer, is planning to introduce a new line of sweaters as part of the winter collection for $65 with an inventory of 1500. The main selling season is 60 days between November and December. The store then sells the remaining units in a clearance sale at 65 percent discount. Out of the 60 main retail days, Fiberia sells the sweaters at full retail price for only 45 days, while giving a discount of 25 percent for the remaining 15 days. The demand functions a, and b are given as 79.5 and 1.1 respectively.
-Calculate the total revenue during the full retail sales period.
A) $23,400
B) $16,200
C) $2,880
D) $17,550
Unlock Deck
Unlock for access to all 67 flashcards in this deck.
Unlock Deck
k this deck
36
Use the table below to answer the following question(s).
Dresden Pharmaceuticals has decided to go ahead and start clinical trials on a potential new drug. The total R&D costs are estimated to reach around $875,000,000 with clinical trials mounting to
$145,000,000. The current market size is estimated to be around 3,000,000 and is expected to grow at 4 percent every year. The market share Dresden hopes to capture in the first year is 7 percent, and is projected to grow by 25 percent each year for the next 4 years. A monthly prescription is anticipated to generate revenue of $420 while incurring variable costs of $150. A discount rate of 8 percent is assumed.
-Calculate the annual cost incurred for the second year.
A) $1,224,120,000
B) $884,520,000
C) $491,400,000
D) $638,820,000
Unlock Deck
Unlock for access to all 67 flashcards in this deck.
Unlock Deck
k this deck
37
Use the table below to answer the following question(s).
Below is a room overbooking model spreadsheet for the Metza, a hotel chain. The hotel has 425 rooms priced at $180 per day each, and is usually fully booked. Reservations can be cancelled any time before 5:00 p.m. with no penalty. The hotel estimates an average overbooking cost of
$150. Customer demand is set at 400 with an average cancellation of 20.
-Calculate the net revenue.
A) $72,900
B) $76,500
C) $64,650
D) $68,400
Unlock Deck
Unlock for access to all 67 flashcards in this deck.
Unlock Deck
k this deck
38
Use the table below to answer the following question(s).
Sheila joined Simsin Tradings at the age of 36 with a starting salary of $75,000. She expects a salary increase of 5 percent every year. Her retirement plan requires her to pay 9 percent of her salary, while the company matches it at 32 percent. She expects an annual return of 7 percent on her retirement portfolio. Using a predictive model for Sheila's first five years, calculate the following, assuming that the salary increases at the same rate every year, and the return of interest does not change.
-What will be Sheila's salary in her second year of work at Simsin?
A) $81,750
B) $82,688
C) $78,750
D) $ 75,000
Unlock Deck
Unlock for access to all 67 flashcards in this deck.
Unlock Deck
k this deck
39
Which of the following years shows the first profit for Dresden's new drug?
A) first year
B) second year
C) third year
D) fourth year
A) first year
B) second year
C) third year
D) fourth year
Unlock Deck
Unlock for access to all 67 flashcards in this deck.
Unlock Deck
k this deck
40
Identify different business uses for statistics and the major statistical tools businesses use
Use the table below to answer the following question(s).
Sujito Electronix makes headphones for $22 and sells them for $32. Sujito has sold at least 50 headphones on average per week in the past, though the actual demand is unknown. Sujito has also often run short of supply in the past. After three months of release, the headphones are sold at 40 percent discount. The spreadsheet below shows Sujito's sales and demand for the headphones. We take demand at 51, and quantity produced at 55.
-Which of the following is the value for quantity sold?
A) 51
B) 50
C) 4
D) 55
Unlock Deck
Unlock for access to all 67 flashcards in this deck.
Unlock Deck
k this deck
41
Use the table below to answer the following question(s).
In the spreadsheet below, there is data on the price, cost, demand, and quantity produced for an item. There are also different "what if" values that can help a manager to calculate costs and revenue with variability in demand.
-From the "what if" values, calculate the total cost when demand is 40,000.
A) $ 2,000,000
B) $1,925,000
C) $1,100,000
D) $75,000
Unlock Deck
Unlock for access to all 67 flashcards in this deck.
Unlock Deck
k this deck
42
Blue Sunset Band is planning to record a new album. A major decision to be made is if the band can record the album on their own, or if they should hire a studio to record it with. The fixed cost for recording at the studio is $100,000, plus the manufacturing cost per CD, which is at $5. If they record the album in-house, the cost per CD is $10. They plan to produce 3000 copies of the album regardless of the place of recording. If the band wished to break even with the cost, how can they achieve this by using the Goal Seek feature in Excel?
Unlock Deck
Unlock for access to all 67 flashcards in this deck.
Unlock Deck
k this deck
43
Use the table below to answer the following question(s).
In the spreadsheet below, there is data on the price, cost, demand, and quantity produced for an item. There are also different "what if" values that can help a manager to calculate costs and revenue with variability in demand.
-From the "what if" values, calculate the revenue if the demand is 60,000 units.
A) $2,750,000
B) $825,000
C) $75,000
D) $1,375,000
Unlock Deck
Unlock for access to all 67 flashcards in this deck.
Unlock Deck
k this deck
44
Calculate the economic value of a loyal customer for a company given that the customer purchases, on an average, worth $43worth per visit and comes three times a year. The company's gross profit margin is 35 per cent with a customer defection rate of 0.4.
Unlock Deck
Unlock for access to all 67 flashcards in this deck.
Unlock Deck
k this deck
45
In Excel's Analytic Solver Platform, a parameter is a set of outputs in a model.
Unlock Deck
Unlock for access to all 67 flashcards in this deck.
Unlock Deck
k this deck
46
Use the table below to answer the following question(s).
In the spreadsheet below, there is data on the price, cost, demand, and quantity produced for an item. There are also different "what if" values that can help a manager to calculate costs and revenue with variability in demand.
-Calculate the total revenue when the quantity produced is 55,000 and demand is 60,000.
A) $1,375,000
B) ($1,320,000)
C) $1,430,000
D) $2,750,000
Unlock Deck
Unlock for access to all 67 flashcards in this deck.
Unlock Deck
k this deck
47
Use the table below to answer the following question(s).
In the spreadsheet below, there is data on the price, cost, demand, and quantity produced for an item. There are also different "what if" values that can help a manager to calculate costs and revenue with variability in demand.
-From the "what if" values, calculate the net profit when the demand is 65,000.
A) $825,000
B) $1,650,000
C) $800,000
D) $925,000
Unlock Deck
Unlock for access to all 67 flashcards in this deck.
Unlock Deck
k this deck
48
Use the table below to answer the following question(s).
In the spreadsheet below, there is data on the price, cost, demand, and quantity produced for an item. There are also different "what if" values that can help a manager to calculate costs and revenue with variability in demand.
-is the term used by Analytic Solver Platform for systematic methods of "what-if" study.
A) Scenario
B) Validity
C) Parametric sensitivity analysis
D) Goal Seek
Unlock Deck
Unlock for access to all 67 flashcards in this deck.
Unlock Deck
k this deck
49
In predictive modeling, validity refers to how well a model represents reality.
Unlock Deck
Unlock for access to all 67 flashcards in this deck.
Unlock Deck
k this deck
50
Use a modern software tool to perform statistical calculations.
Use the table below to answer the following question(s).
Fiberia Accessories, a clothing retailer, is planning to introduce a new line of sweaters as part of the winter collection for $65 with an inventory of 1500. The main selling season is 60 days between November and December. The store then sells the remaining units in a clearance sale at 65 percent discount. Out of the 60 main retail days, Fiberia sells the sweaters at full retail price for only 45 days, while giving a discount of 25 percent for the remaining 15 days. The demand functions a, and b are given as 79.5 and 1.1 respectively.
-Calculate the total revenue during the discount sales period.
A) $4,478.91
B) $18,921.09
C) $10,042.73
D) $43,321.09
Unlock Deck
Unlock for access to all 67 flashcards in this deck.
Unlock Deck
k this deck
51
Use the table below to answer the following question(s).
In the spreadsheet below, there is data on the price, cost, demand, and quantity produced for an item. There are also different "what if" values that can help a manager to calculate costs and revenue with variability in demand.
-Which of the following is the Excel formula to determine the number of units sold?
A) =B8
B) =MIN(0,B8,B9)
C) =MIN(B8,B9)
D) =MAX(0,B8,B9)
Unlock Deck
Unlock for access to all 67 flashcards in this deck.
Unlock Deck
k this deck
52
Use a modern software tool to perform statistical calculations.
Use the table below to answer the following question(s).
Fiberia Accessories, a clothing retailer, is planning to introduce a new line of sweaters as part of the winter collection for $65 with an inventory of 1500. The main selling season is 60 days between November and December. The store then sells the remaining units in a clearance sale at 65 percent discount. Out of the 60 main retail days, Fiberia sells the sweaters at full retail price for only 45 days, while giving a discount of 25 percent for the remaining 15 days. The demand functions a, and b are given as 79.5 and 1.1 respectively.
-Calculate the total revenue for the new line of sweaters.
A) $59,426.25
B) $48,871.88
C) $23,400
D) $43,231.09
Unlock Deck
Unlock for access to all 67 flashcards in this deck.
Unlock Deck
k this deck
53
Two-way data tables can evaluate only one output variable.
Unlock Deck
Unlock for access to all 67 flashcards in this deck.
Unlock Deck
k this deck
54
Use a modern software tool to perform statistical calculations.
Use the table below to answer the following question(s).
Fiberia Accessories, a clothing retailer, is planning to introduce a new line of sweaters as part of the winter collection for $65 with an inventory of 1500. The main selling season is 60 days between November and December. The store then sells the remaining units in a clearance sale at 65 percent discount. Out of the 60 main retail days, Fiberia sells the sweaters at full retail price for only 45 days, while giving a discount of 25 percent for the remaining 15 days. The demand functions a, and b are given as 79.5 and 1.1 respectively.
-Calculate the revenue for the clearance sales period.
A) $18,921.09
B) $23,400
C) $48,871.88
D) $17,105.16
Unlock Deck
Unlock for access to all 67 flashcards in this deck.
Unlock Deck
k this deck
55
Use a modern software tool to perform statistical calculations.
Use the table below to answer the following question(s).
Fiberia Accessories, a clothing retailer, is planning to introduce a new line of sweaters as part of the winter collection for $65 with an inventory of 1500. The main selling season is 60 days between November and December. The store then sells the remaining units in a clearance sale at 65 percent discount. Out of the 60 main retail days, Fiberia sells the sweaters at full retail price for only 45 days, while giving a discount of 25 percent for the remaining 15 days. The demand functions a, and b are given as 79.5 and 1.1 respectively.
-Calculate the total units sold during the discount sales period.
A) 388.13
B) 25.88
C) 133.3
D) 39.28
Unlock Deck
Unlock for access to all 67 flashcards in this deck.
Unlock Deck
k this deck
56
Use the table below to answer the following question(s).
In the spreadsheet below, there is data on the price, cost, demand, and quantity produced for an item. There are also different "what if" values that can help a manager to calculate costs and revenue with variability in demand.
-From the "what if" values, calculate the total profit when the demand is 20,000.
A) $825,000
B) $1,000,000
C) $1,100,000
D) ($925,000)
Unlock Deck
Unlock for access to all 67 flashcards in this deck.
Unlock Deck
k this deck
57
The process of developing good, useful, and correct spreadsheet models is known as spreadsheet engineering.
Unlock Deck
Unlock for access to all 67 flashcards in this deck.
Unlock Deck
k this deck
58
Brenton joined the Kroos Corporation at a starting salary of $61,500. According to the company's retirement plan, Brenton has to make a retirement contribution of 6 percent of his salary. The company contributes 30 percent of this amount. Brenton is expected to receive a salary increment of 3.5 percent per year for the next three years. Brenton is also expected to receive an annual investment return of 8 percent on the plan. Assuming the same rate of salary increases and investment returns each year, calculate the total balance of the retirement plan in its second year.
Unlock Deck
Unlock for access to all 67 flashcards in this deck.
Unlock Deck
k this deck
59
Use the table below to answer the following question(s).
In the spreadsheet below, there is data on the price, cost, demand, and quantity produced for an item. There are also different "what if" values that can help a manager to calculate costs and revenue with variability in demand.
-Calculate the variable cost when the demand is 60,000 units.
A) $1,430,000
B) $1,375,000
C) $2,750,000
D) $1,320,000
Unlock Deck
Unlock for access to all 67 flashcards in this deck.
Unlock Deck
k this deck
60
Gruten Retailers sells Mother's Day special greeting cards at their store at $6. They make the cards for a dollar apiece. Most of the cards are sold by Mother's Day, but the actual demand is unknown. They have orders for 120 cards. In the past, they have had sales of at least 100 cards by Mother's Day. The remaining cards are sold at a 40 percent discount. Calculate the net profit, if demand, D, is set at 110 units.
Unlock Deck
Unlock for access to all 67 flashcards in this deck.
Unlock Deck
k this deck
61
Explain how the Data Validation feature in Excel helps in increasing spreadsheet quality.
Unlock Deck
Unlock for access to all 67 flashcards in this deck.
Unlock Deck
k this deck
62
Give an account of how the design and format of spreadsheets can be improved.
Unlock Deck
Unlock for access to all 67 flashcards in this deck.
Unlock Deck
k this deck
63
Explain how a two-way data table is created.
Unlock Deck
Unlock for access to all 67 flashcards in this deck.
Unlock Deck
k this deck
64
How does a tornado chart help make sense of inputs in analyzing data and models?
Unlock Deck
Unlock for access to all 67 flashcards in this deck.
Unlock Deck
k this deck
65
How can managers judge the validity of a model?
Unlock Deck
Unlock for access to all 67 flashcards in this deck.
Unlock Deck
k this deck
66
Give an account of how data is used in predictive models.
Unlock Deck
Unlock for access to all 67 flashcards in this deck.
Unlock Deck
k this deck
67
Discuss how overbooking decisions are made by service businesses.
Unlock Deck
Unlock for access to all 67 flashcards in this deck.
Unlock Deck
k this deck
Unlock Deck
Unlock for access to all 67 flashcards in this deck.


