Deck 3: Looking at Data: Frequency Distributions and Graphs
Full screen (f)
Question
Question
Question
Question
Question
Question
Question
Question
Question
Question
Question
Question
Question
Question
Question
The formula for the percentage frequency of a score in a distribution is given by.
A)
B)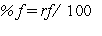
C)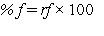
A)
B)
C)
Question
Question
Question
Question
Question
Question
Question
Question
Question
Question
Question
Question
Question
Question
Question
Question
Question
Question
Question
Question
Question
Question
The formula ( f of scores in interval) N provides the grouped frequency.
A)simple
B)cumulative
C)relative
D)percentage
A)simple
B)cumulative
C)relative
D)percentage
Question
Question
Question
Question
Question
Question
Question
Question
Question
Question
Question
Question
Question
Question
Question
Question
Question
Question
Question
Question
Question
Question

Unlock Deck
Sign up to unlock the cards in this deck!
Unlock Deck
Unlock Deck
1/59
Play
Full screen (f)
Deck 3: Looking at Data: Frequency Distributions and Graphs
1
The symbol f in an ungrouped frequency distribution is used to represent the.
A)total number of scores
B)number of the subject contributing the score
C)relative frequency of occurrence of each score
D)simple frequency of occurrence of each score
A)total number of scores
B)number of the subject contributing the score
C)relative frequency of occurrence of each score
D)simple frequency of occurrence of each score
D
2
In a grouped frequency distribution, the range of score values into which the raw scores are grouped is called the.
A)class interval
B)class range
C)score range
D)group interval
A)class interval
B)class range
C)score range
D)group interval
A
3
The formula (Xhighest - Xlowest) ⁄ number of intervals provides the in a grouped frequency distribution.
A)relative frequency of a score
B)midpoint of a class interval
C)size of a class interval
D)lower and upper real limits of a class interval
A)relative frequency of a score
B)midpoint of a class interval
C)size of a class interval
D)lower and upper real limits of a class interval
C
4
The total number of scores collected from a group of participants is identified by .
A)T
B)Total
C)N
D)S
A)T
B)Total
C)N
D)S
Unlock Deck
Unlock for access to all 59 flashcards in this deck.
Unlock Deck
k this deck
5
Dividing the difference between the largest score and the smallest score in a distribution by the number of class intervals yields the of the class interval.
A)size
B)midpoint
C)cumulative frequency
D)limits
A)size
B)midpoint
C)cumulative frequency
D)limits
Unlock Deck
Unlock for access to all 59 flashcards in this deck.
Unlock Deck
k this deck
6
Listing each possible score value and then placing a tally mark next to each score for each time it occurs in a set of scores results in a(n) frequency distribution.
A)ungrouped
B)grouped
C)relative
D)cumulative
A)ungrouped
B)grouped
C)relative
D)cumulative
Unlock Deck
Unlock for access to all 59 flashcards in this deck.
Unlock Deck
k this deck
7
In a(n) frequency distribution, scores are placed into.
A)simple; class intervals
B)grouped; class intervals
C)ungrouped; class intervals
D)percentage; class limits
A)simple; class intervals
B)grouped; class intervals
C)ungrouped; class intervals
D)percentage; class limits
Unlock Deck
Unlock for access to all 59 flashcards in this deck.
Unlock Deck
k this deck
8
The scores of a subject exactly as collected and before they are analyzed statistically are called.
A)uninterpreted scores
B)basic data
C)collected data
D)raw data
A)uninterpreted scores
B)basic data
C)collected data
D)raw data
Unlock Deck
Unlock for access to all 59 flashcards in this deck.
Unlock Deck
k this deck
9
A table showing each score in a set of scores and the number of times it occurred is called a.
A)histogram
B)frequency distribution
C)frequency polygon
D)frequency polygram
A)histogram
B)frequency distribution
C)frequency polygon
D)frequency polygram
Unlock Deck
Unlock for access to all 59 flashcards in this deck.
Unlock Deck
k this deck
10
The symbol % f is used to represent the of a score in a distribution.
A)simple frequency
B)percentage frequency
C)relative frequency
D)percentage of participants contributing scores to the distribution
A)simple frequency
B)percentage frequency
C)relative frequency
D)percentage of participants contributing scores to the distribution
Unlock Deck
Unlock for access to all 59 flashcards in this deck.
Unlock Deck
k this deck
11
The size of a class interval in a grouped frequency distribution is represented by.
A)sz
B)i
C)c
D)f
A)sz
B)i
C)c
D)f
Unlock Deck
Unlock for access to all 59 flashcards in this deck.
Unlock Deck
k this deck
12
The number of class intervals used in constructing a grouped frequency distribution typically is between.
A)1 to 5
B)1 to 10
C)10 to 20
D)5 to 15
A)1 to 5
B)1 to 10
C)10 to 20
D)5 to 15
Unlock Deck
Unlock for access to all 59 flashcards in this deck.
Unlock Deck
k this deck
13
Multiplying rf by 100 yields frequency.
A)percentage
B)relative
C)cumulative
D)summated
A)percentage
B)relative
C)cumulative
D)summated
Unlock Deck
Unlock for access to all 59 flashcards in this deck.
Unlock Deck
k this deck
14
The frequency of a particular score divided by the total number of scores in the distribution is the frequency of a score.
A)simple
B)relative
C)cumulative
D)percentage
A)simple
B)relative
C)cumulative
D)percentage
Unlock Deck
Unlock for access to all 59 flashcards in this deck.
Unlock Deck
k this deck
15
The formula for the percentage frequency of a score in a distribution is given by.
A)
B)
C)
A)
B)
C)
Unlock Deck
Unlock for access to all 59 flashcards in this deck.
Unlock Deck
k this deck
16
Dividing the frequency of a score by the total number of scores in the distribution of scores will yield the of a score.
A)simple frequency
B)cumulative frequency
C)percentile
D)relative frequency
A)simple frequency
B)cumulative frequency
C)percentile
D)relative frequency
Unlock Deck
Unlock for access to all 59 flashcards in this deck.
Unlock Deck
k this deck
17
If the computed class interval for a frequency distribution is equal to 4.25, then the actual class interval used should be.
A)4.0
B)4.25
C)4.245 to 4.255
D)5.0
A)4.0
B)4.25
C)4.245 to 4.255
D)5.0
Unlock Deck
Unlock for access to all 59 flashcards in this deck.
Unlock Deck
k this deck
18
Dividing the frequency of scores in an interval by the total number of scores in a grouped frequency distribution yields the grouped frequency.
A)relative
B)simple
C)cumulative
D)percentage
A)relative
B)simple
C)cumulative
D)percentage
Unlock Deck
Unlock for access to all 59 flashcards in this deck.
Unlock Deck
k this deck
19
For the class interval of 20-25, the lower stated limit is.
A)19.5
B)20.0
C)25.0
D)21.0
A)19.5
B)20.0
C)25.0
D)21.0
Unlock Deck
Unlock for access to all 59 flashcards in this deck.
Unlock Deck
k this deck
20
A frequency distribution most easily allows comparisons between two distributions of scores with a different number of scores in each distribution.
A)simple
B)comparison
C)raw data
D)relative
A)simple
B)comparison
C)raw data
D)relative
Unlock Deck
Unlock for access to all 59 flashcards in this deck.
Unlock Deck
k this deck
21
The percentile rank of Jaima's score on a statistics exam was 83. This value indicates that .
A)83 percent of the scores on the exam were equal to or greater than Jaima's
B)Jaima obtained 83 out of 100 on the exam
C)27 percent of the scores on the exam were less than Jaima's
D)83 percent of the scores on the exam were equal to or less than Jaima's
A)83 percent of the scores on the exam were equal to or greater than Jaima's
B)Jaima obtained 83 out of 100 on the exam
C)27 percent of the scores on the exam were less than Jaima's
D)83 percent of the scores on the exam were equal to or less than Jaima's
Unlock Deck
Unlock for access to all 59 flashcards in this deck.
Unlock Deck
k this deck
22
The grouped percentage frequency is determined by.
A)dividing the grouped relative frequency by 100
B)adding 100 to the grouped absolute frequency
C)subtracting 100 from the grouped cumulative frequency
D)multiplying the grouped relative frequency by 100
A)dividing the grouped relative frequency by 100
B)adding 100 to the grouped absolute frequency
C)subtracting 100 from the grouped cumulative frequency
D)multiplying the grouped relative frequency by 100
Unlock Deck
Unlock for access to all 59 flashcards in this deck.
Unlock Deck
k this deck
23
The midpoint of the class interval 30 to 34 is.
A)32.5
B)31.5
C)31.0
D)32.0
A)32.5
B)31.5
C)31.0
D)32.0
Unlock Deck
Unlock for access to all 59 flashcards in this deck.
Unlock Deck
k this deck
24
The relative location of a score in a distribution is indicated by its.
A)percentile
B)symmetry
C)modality
D)skewness
A)percentile
B)symmetry
C)modality
D)skewness
Unlock Deck
Unlock for access to all 59 flashcards in this deck.
Unlock Deck
k this deck
25
If the 30th percentile on an examination is 65, then.
A)30 percent of the people got a score of 65
B)more than 30 percent of the people failed the exam
C)30 percent of the people got a score above 65
D)30 percent of the people got a score of 65 or less
A)30 percent of the people got a score of 65
B)more than 30 percent of the people failed the exam
C)30 percent of the people got a score above 65
D)30 percent of the people got a score of 65 or less
Unlock Deck
Unlock for access to all 59 flashcards in this deck.
Unlock Deck
k this deck
26
The symbol c%f represents the frequency.
A)summed relative
B)cumulative percentage
C)summed simple
D)cumulative relative
A)summed relative
B)cumulative percentage
C)summed simple
D)cumulative relative
Unlock Deck
Unlock for access to all 59 flashcards in this deck.
Unlock Deck
k this deck
27
The formula (rf of scores in interval) × 100 provides the grouped frequency.
A)simple
B)cumulative
C)relative
D)percentage
A)simple
B)cumulative
C)relative
D)percentage
Unlock Deck
Unlock for access to all 59 flashcards in this deck.
Unlock Deck
k this deck
28
For the class interval of 10-15, the upper stated limit is ; whereas the upper real limit is.
A)15.0; 15.5
B)15.0; 14.5
C)14.5; 15.0
D)15.5; 15.0
A)15.0; 15.5
B)15.0; 14.5
C)14.5; 15.0
D)15.5; 15.0
Unlock Deck
Unlock for access to all 59 flashcards in this deck.
Unlock Deck
k this deck
29
The symbol crf represents the frequency.
A)summed relative
B)cumulative percentage
C)summed simple
D)cumulative relative
A)summed relative
B)cumulative percentage
C)summed simple
D)cumulative relative
Unlock Deck
Unlock for access to all 59 flashcards in this deck.
Unlock Deck
k this deck
30
The frequency of a class interval plus the frequencies of all lower class intervals is the grouped frequency of a distribution.
A)simple
B)summed
C)cumulative
D)relative
A)simple
B)summed
C)cumulative
D)relative
Unlock Deck
Unlock for access to all 59 flashcards in this deck.
Unlock Deck
k this deck
31
The midpoint of a class interval is midway between the limits of the interval.
A)implied
B)tested
C)real
D)hypothetical
A)implied
B)tested
C)real
D)hypothetical
Unlock Deck
Unlock for access to all 59 flashcards in this deck.
Unlock Deck
k this deck
32
For the class interval of 10-15, the lower stated limit is ; whereas the lower real limit is.
A)9.5; 9.5
B)9.0; 10.0
C)10.0; 9.5
D)10.0; 9.0
A)9.5; 9.5
B)9.0; 10.0
C)10.0; 9.5
D)10.0; 9.0
Unlock Deck
Unlock for access to all 59 flashcards in this deck.
Unlock Deck
k this deck
33
A percentile is.
A)the percentage of scores in a distribution equal to or greater than a particular score
B)a score at or above which a specified percentage of the scores in a distribution fall
C)a score at or below which a specified percentage of the scores in a distribution fall
D)always the midpoint of a class interval
Unlock Deck
Unlock for access to all 59 flashcards in this deck.
Unlock Deck
k this deck
34
The grouped relative frequency of a class interval plus the sum of the relative frequencies of all lower class intervals is the frequency of a distribution.
A)summed grouped relative
B)cumulative grouped relative
C)cumulative grouped percentage
D)cumulative simple
A)summed grouped relative
B)cumulative grouped relative
C)cumulative grouped percentage
D)cumulative simple
Unlock Deck
Unlock for access to all 59 flashcards in this deck.
Unlock Deck
k this deck
35
For the class interval of 20-25, the lower real limit is.
A)19.5
B)20.0
C)19.0
D)20.5
A)19.5
B)20.0
C)19.0
D)20.5
Unlock Deck
Unlock for access to all 59 flashcards in this deck.
Unlock Deck
k this deck
36
If the 40th percentile on an examination is 75, then.
A)40 percent of the people got a score of 75
B)less than 40 percent of the people got a score higher than 75
C)40 percent of the people got a score of 75 or less
D)60 percent of the people got a score lower than 75
A)40 percent of the people got a score of 75
B)less than 40 percent of the people got a score higher than 75
C)40 percent of the people got a score of 75 or less
D)60 percent of the people got a score lower than 75
Unlock Deck
Unlock for access to all 59 flashcards in this deck.
Unlock Deck
k this deck
37
The formula ( f of scores in interval) N provides the grouped frequency.
A)simple
B)cumulative
C)relative
D)percentage
A)simple
B)cumulative
C)relative
D)percentage
Unlock Deck
Unlock for access to all 59 flashcards in this deck.
Unlock Deck
k this deck
38
A percentile is used to describe the a distribution.
A)shape of
B)relative location of a score in
C)skewness of
D)symmetry of
A)shape of
B)relative location of a score in
C)skewness of
D)symmetry of
Unlock Deck
Unlock for access to all 59 flashcards in this deck.
Unlock Deck
k this deck
39
For the class interval of 20-25, the upper real limit is.
A)25.0
B)25.5
C)26.0
D)24.5
A)25.0
B)25.5
C)26.0
D)24.5
Unlock Deck
Unlock for access to all 59 flashcards in this deck.
Unlock Deck
k this deck
40
The grouped percentage frequency of a class interval plus the sum of the percentage frequencies of all lower class intervals is the frequency of a distribution.
A)cumulative grouped percentage
B)cumulative grouped relative
C)summated grouped percentage
D)summated grouped relative
A)cumulative grouped percentage
B)cumulative grouped relative
C)summated grouped percentage
D)summated grouped relative
Unlock Deck
Unlock for access to all 59 flashcards in this deck.
Unlock Deck
k this deck
41
In a histogram, the is represented by the width of the bar on the abscissa.
A)size of the class interval
B)relative frequency of the interval
C)percentage frequency
D)lower stated limit and the upper real limit
A)size of the class interval
B)relative frequency of the interval
C)percentage frequency
D)lower stated limit and the upper real limit
Unlock Deck
Unlock for access to all 59 flashcards in this deck.
Unlock Deck
k this deck
42
If more scores are clustered at the high-score end of a distribution and only a few scores are at the low-score end, then the distribution is.
A)symmetrical and unimodal
B)asymmetrical and bimodal
C)positively skewed
D)negatively skewed
A)symmetrical and unimodal
B)asymmetrical and bimodal
C)positively skewed
D)negatively skewed
Unlock Deck
Unlock for access to all 59 flashcards in this deck.
Unlock Deck
k this deck
43
When plotting a graph of a frequency distribution, the is/are placed on the Y axis.
A)frequency of the scores
B)scores or class intervals of the scores
C)subject identification numbers
D)value of N
A)frequency of the scores
B)scores or class intervals of the scores
C)subject identification numbers
D)value of N
Unlock Deck
Unlock for access to all 59 flashcards in this deck.
Unlock Deck
k this deck
44
An examination that clearly distinguished between those students who knew the material and those who did not would most likely yield a distribution.
A)symmetrical
B)bimodal
C)unimodal
D)unimodal and symmetrical
A)symmetrical
B)bimodal
C)unimodal
D)unimodal and symmetrical
Unlock Deck
Unlock for access to all 59 flashcards in this deck.
Unlock Deck
k this deck
45
If more scores are clustered toward the low end of a frequency distribution and only a few scores are at the high end, then the distribution is.
A)unimodal
B)multimodal
C)negatively skewed
D)positively skewed
A)unimodal
B)multimodal
C)negatively skewed
D)positively skewed
Unlock Deck
Unlock for access to all 59 flashcards in this deck.
Unlock Deck
k this deck
46
In a histogram, the the class interval is given by the height of the bar.
A)size of
B)cumulative frequency of
C)lower stated limit and the upper real limit of
D)frequency of scores in
A)size of
B)cumulative frequency of
C)lower stated limit and the upper real limit of
D)frequency of scores in
Unlock Deck
Unlock for access to all 59 flashcards in this deck.
Unlock Deck
k this deck
47
The symmetrical bell-shaped frequency distribution is also known as the distribution.
A)natural
B)common
C)normal
D)modal
A)natural
B)common
C)normal
D)modal
Unlock Deck
Unlock for access to all 59 flashcards in this deck.
Unlock Deck
k this deck
48
A distribution in which one side is the mirror image of the other side is.
A)symmetrical
B)asymmetrical
C)unimodal
D)bimodal
A)symmetrical
B)asymmetrical
C)unimodal
D)bimodal
Unlock Deck
Unlock for access to all 59 flashcards in this deck.
Unlock Deck
k this deck
49
A bimodal distribution has "peaks."
A)no
B)one
C)two
D)three or more
A)no
B)one
C)two
D)three or more
Unlock Deck
Unlock for access to all 59 flashcards in this deck.
Unlock Deck
k this deck
50
A bar graph is used to present data, whereas a histogram is used to present data.
A)quantitative; qualitative
B)qualitative; quantitative
C)continuous; discrete
D)statistical; population
A)quantitative; qualitative
B)qualitative; quantitative
C)continuous; discrete
D)statistical; population
Unlock Deck
Unlock for access to all 59 flashcards in this deck.
Unlock Deck
k this deck
51
An examination that is so difficult that many people get low scores and only a few get high scores would create a.
A)negatively skewed distribution
B)bimodal frequency polygon
C)rectangular distribution
D)positively skewed distribution
A)negatively skewed distribution
B)bimodal frequency polygon
C)rectangular distribution
D)positively skewed distribution
Unlock Deck
Unlock for access to all 59 flashcards in this deck.
Unlock Deck
k this deck
52
Connecting dots indicating the frequency at the midpoints of class intervals with straight lines yields a.
A)histogram
B)frequency polygon
C)skewed distribution
D)multimodal distribution
A)histogram
B)frequency polygon
C)skewed distribution
D)multimodal distribution
Unlock Deck
Unlock for access to all 59 flashcards in this deck.
Unlock Deck
k this deck
53
Suppose an examination was very easy and all but a few students obtained a high grade on it. The frequency distribution of these scores would be.
A)negatively skewed
B)positively skewed
C)symmetrical
D)multimodal
A)negatively skewed
B)positively skewed
C)symmetrical
D)multimodal
Unlock Deck
Unlock for access to all 59 flashcards in this deck.
Unlock Deck
k this deck
54
The height of a vertical bar is used to represent the frequency of occurrence of scores in a .
A)simple frequency distribution
B)stem-and-leaf plot
C)histogram
D)frequency polygon
A)simple frequency distribution
B)stem-and-leaf plot
C)histogram
D)frequency polygon
Unlock Deck
Unlock for access to all 59 flashcards in this deck.
Unlock Deck
k this deck
55
When plotting a graph of a frequency distribution, the is/are placed on the X axis.
A)frequency of the scores
B)scores or class intervals of the scores
C)subject identification numbers
D)value of N
A)frequency of the scores
B)scores or class intervals of the scores
C)subject identification numbers
D)value of N
Unlock Deck
Unlock for access to all 59 flashcards in this deck.
Unlock Deck
k this deck
56
When looking at a graph, a Y-axis with no numbers.
A)is never a problem as people just don't like to look at numbers.
B)is correct as the numbers should only be listed on the X-axis.
C)could be a sign that someone is trying to mask what is really going on with the data.
D)is a good idea as it keeps people's focus on the graph.
A)is never a problem as people just don't like to look at numbers.
B)is correct as the numbers should only be listed on the X-axis.
C)could be a sign that someone is trying to mask what is really going on with the data.
D)is a good idea as it keeps people's focus on the graph.
Unlock Deck
Unlock for access to all 59 flashcards in this deck.
Unlock Deck
k this deck
57
When thinking about the accuracy of a graph,
A)bar graphs are always the most accurate.
B)histograms are always the most accurate.
C)remember that a graph is seldom misleading.
D)remember that a graph may be misleading.
A)bar graphs are always the most accurate.
B)histograms are always the most accurate.
C)remember that a graph is seldom misleading.
D)remember that a graph may be misleading.
Unlock Deck
Unlock for access to all 59 flashcards in this deck.
Unlock Deck
k this deck
58
The normal distribution is.
A)symmetrical and bell-shaped
B)symmetrical and bimodal
C)positively skewed
D)negatively skewed
A)symmetrical and bell-shaped
B)symmetrical and bimodal
C)positively skewed
D)negatively skewed
Unlock Deck
Unlock for access to all 59 flashcards in this deck.
Unlock Deck
k this deck
59
If a distribution has scores clustered more at one end than at the other, then the distribution is.
A)unimodal
B)symmetrical
C)skewed
D)bimodal
A)unimodal
B)symmetrical
C)skewed
D)bimodal
Unlock Deck
Unlock for access to all 59 flashcards in this deck.
Unlock Deck
k this deck
Unlock Deck
Unlock for access to all 59 flashcards in this deck.


