Deck 14: Hypothesis Testing: Comparing Two Populations
Full screen (f)
Question
Question
When the necessary conditions are met, a two-tail test is being conducted to test the difference between two population means, but your statistical software provides only a one-tail area of 0.028 as part of its output. The p-value for this test will be: 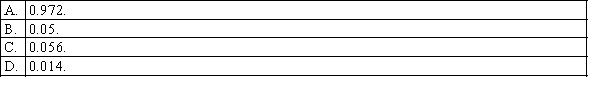
Question
In testing the difference between two population means, using two independent samples, the sampling distribution of the sample mean difference  is normal if the:
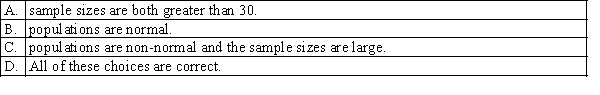
is normal if the: Question
When the necessary conditions are met, a two-tail test is being conducted to test the difference between two population proportions. The two sample proportions are p1 = 0.25 and p2 = 0.20 and the standard error of the sampling distribution of  is 0.04. The calculated value of the test statistic will be:
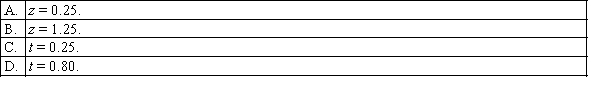
is 0.04. The calculated value of the test statistic will be: Question
We can design a matched pairs experiment when the data collected are: 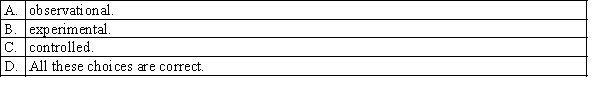
Question
A political analyst in Perth surveys a random sample of Labor Party members and compares the results with those obtained from a random sample of Liberal Party members. This would be an example of: 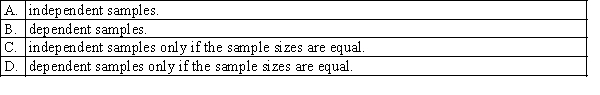
Question
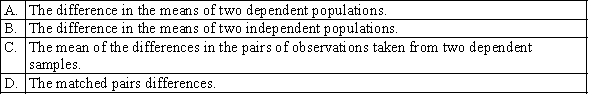
Which of the following best describes the symbol  ?
? 
? Question
In testing the difference between two population means, using two independent samples, we use the pooled variance in estimating the standard error of the sampling distribution of the sample mean difference  if the:
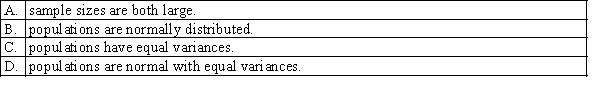
if the: Question
A sample of size 150 from population 1 has 40 successes. A sample of size 250 from population 2 has 30 successes. The value of the test statistic for testing the null hypothesis that the proportion of successes in population 1 exceeds the proportion of successes in population 2 by 0.05 is: 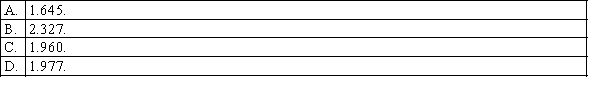
Question
In testing the difference between two population means, for which the population variances are unknown and are not assumed to be equal, two independent samples of large sizes are drawn from the populations. Which of the following tests is appropriate? 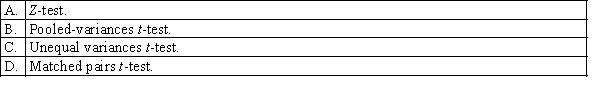
Question
Which of the following is a required condition for using the normal approximation to the binomial distribution in testing the difference between two population proportions? 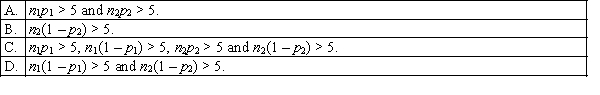
Question
In testing the difference between the means of two normally distributed populations, the number of degrees of freedom associated with the unequal-variances t-test statistic usually results in a non-integer number. It is recommended that you: 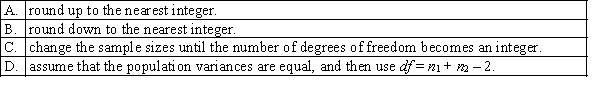
Question
For testing the difference between two population proportions, the pooled proportion estimate should be used to compute the value of the test statistic when the: 
Question
Two samples of sizes 35 and 50 are independently drawn from two normal populations, where the unknown population variances are assumed to be equal. The number of degrees of freedom of the equal-variances t-test statistic are: 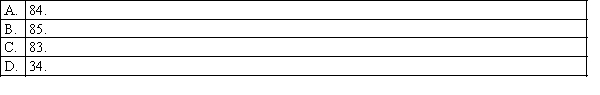
Question
In testing the difference between the means of two normal populations with known population standard deviations the test statistic calculated from two independent random samples equals 2.56. If the test is two-tailed and the 1% level of significance has been specified, the conclusion should be: 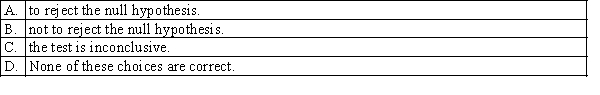
Question
In testing whether the means of two normal populations are equal, summary statistics computed for two independent samples are as follows: n1 = 25,  = 7.30, s1 = 1.05.
N2 = 30, = 6.80, s2 = 1.20.
Assume that the population variances are equal. Then the standard error of the sampling distribution of the sample mean difference is equal to:
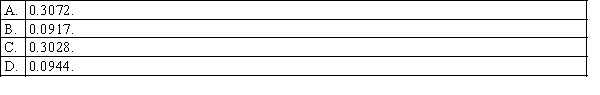
= 7.30, s1 = 1.05.N2 = 30,
= 6.80, s2 = 1.20.Assume that the population variances are equal. Then the standard error of the sampling distribution of the sample mean difference
is equal to: Question
If some natural relationship exists between each pair of observations that provides a logical reason to compare the first observation of sample 1 with the first observation of sample 2, the second observation of sample 1 with the second observation of sample 2, and so on, the samples are referred to as: 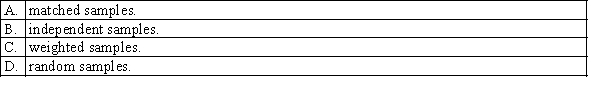
Question
A sample of size 100 selected from one population has 53 successes, and a sample of size 150 selected from a second population has 95 successes. The test statistic for testing the equality of the population proportions is equal to: 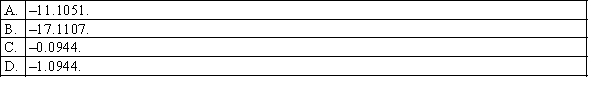
Question
In testing the difference between the means of two normal populations, using two independent samples, when the population variances are unknown and unequal, the sampling distribution of the resulting statistic is: 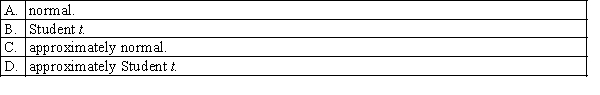
Question
A test is being conducted to test the difference between two population means, using data that are gathered from a matched pairs experiment. If the paired differences are normal, then the distribution used for testing is the: 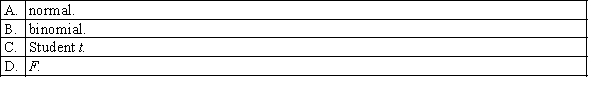
Question
Question
When the necessary conditions are met, a two-tail test is being conducted to test the difference between two population proportions. If the value of the test statistic z is 2.05, then the p-value is: 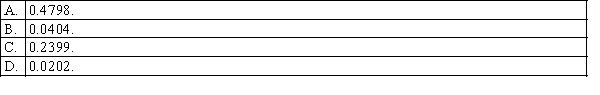
Question
Two independent samples of sizes 30 and 35 are randomly selected from two normal populations with equal variances. Which of the following is the test statistic that should be used to test the difference between the population means? 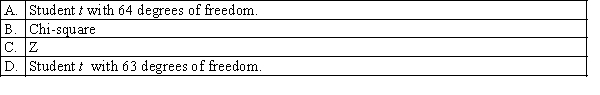
Question
Question
Question
Question
Question
The number of degrees of freedom associated with the t-test, when the data are gathered from a matched pairs experiment with 40 pairs, is: 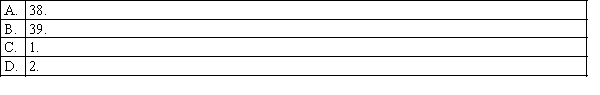
Question
Question
Question
Question
Question
For testing the difference between two population proportions, the pooled proportion estimate should be used to compute the value of the test statistic when the: 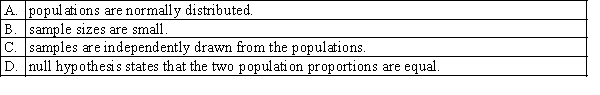
Question
Question
Question
Question
A sample of size 100 selected from one population has 60 successes, and a sample of size 150 selected from a second population has 95 successes. The test statistic for testing the equality of the population proportions is equal to: 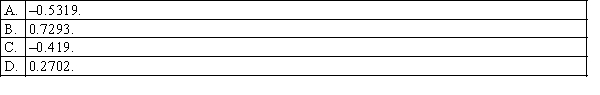
Question
Question
Question
Question
Question
Question
Question
Question
Question
Question
Question
Question
Question
A simple random sample of ten firms was asked how much money (in thousands of dollars) they spent on employee training programs this year and how much they plan to spend on these programs next year. The data are shown below.  Assume that the populations of amount spent on employee training programs are normally distributed.
a. Estimate with 95% confidence the mean difference.
b. Briefly explain what the interval estimate in part a. tells you.
Assume that the populations of amount spent on employee training programs are normally distributed.a. Estimate with 95% confidence the mean difference.
b. Briefly explain what the interval estimate in part a. tells you.
Question
Question
Question
Question
Question
Question
Question
Question
Question
Question
Question
Question
Question
Ten functionally illiterate adults were given an experimental one-week crash course in reading. Each of the 10 was given a reading test prior to the course and another test after the course. The results are shown below. 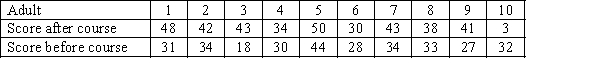 a. Estimate the mean improvement with 95% confidence.
b. Briefly describe what the interval estimate in part a. tells you.
a. Estimate the mean improvement with 95% confidence.b. Briefly describe what the interval estimate in part a. tells you.
Question
A quality control inspector keeps a tally sheet of the numbers of acceptable and unacceptable products that come off two different production lines. The completed sheet is shown below. 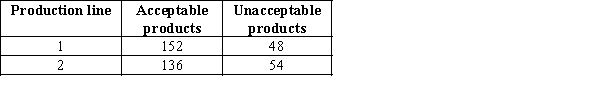 a. What is the p-value of the test?
b. Estimate with 95% confidence the difference in population proportions.
a. What is the p-value of the test?b. Estimate with 95% confidence the difference in population proportions.
Question
Question
Question
Question
Question
Question
A quality control inspector keeps a tally sheet of the numbers of acceptable and unacceptable products that come off two different production lines. The completed sheet is shown below.  Can the inspector infer at the 5% significance level that production line 1 is doing a better job than production line 2?
Can the inspector infer at the 5% significance level that production line 1 is doing a better job than production line 2? Question
Question
The managing director of a breakfast cereal manufacturer claims that families in which both spouses work are much more likely to be consumers of his product than those with only one working spouse. To prove his point, he commissions a survey of 300 families in which both spouses work and 300 families with only one working spouse. Each family is asked whether the company's cereal is eaten for breakfast. The results are shown below.  Use the p-value method to test the managing director's claim, at a 5% significance level of
significance.
Use the p-value method to test the managing director's claim, at a 5% significance level ofsignificance.
Question
Question
Question
Question
Question
Question
The managing director of a breakfast cereal manufacturer believes that families in which both spouses work are much more likely to be consumers of his product than those with only one working spouse. To prove his point, he commissions a survey of 300 families in which both spouses work and 300 families with only one working spouse. Each family is asked whether the company's cereal is eaten for breakfast. The results are shown below. 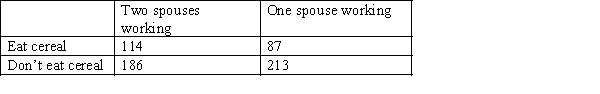 Do these data provide enough evidence at the 1% significance level to infer that the proportion of families with two working spouses who eat the cereal is at least 5% larger than the proportion of families with one working spouse who eats the cereal?
Do these data provide enough evidence at the 1% significance level to infer that the proportion of families with two working spouses who eat the cereal is at least 5% larger than the proportion of families with one working spouse who eats the cereal? Question
Question
Do interstate drivers exceed the speed limit more frequently than local motorists? This vital question was addressed by the Road Traffic Authority. A random sample of the speeds of 2500 randomly selected cars was categorised according to whether the car was registered in the state or in some other state, and whether or not the car was violating the speed limit. The data are shown below. 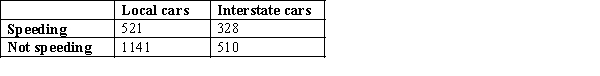 Do these data provide enough evidence to support the highway patrol's claim at the 5% significance level?
Do these data provide enough evidence to support the highway patrol's claim at the 5% significance level?
Unlock Deck
Sign up to unlock the cards in this deck!
Unlock Deck
Unlock Deck
1/81
Play
Full screen (f)
Deck 14: Hypothesis Testing: Comparing Two Populations
1
In testing the null hypothesis H0 = = 0, if H0 is true, the test could lead to: A. a Type I error.
B. a Type II error.
C. either a Type I or a Type II error.
D. None of these choices are correct.
B. a Type II error.
C. either a Type I or a Type II error.
D. None of these choices are correct.
A
2
When the necessary conditions are met, a two-tail test is being conducted to test the difference between two population means, but your statistical software provides only a one-tail area of 0.028 as part of its output. The p-value for this test will be:
C
3
In testing the difference between two population means, using two independent samples, the sampling distribution of the sample mean difference is normal if the:
is normal if the: B
4
When the necessary conditions are met, a two-tail test is being conducted to test the difference between two population proportions. The two sample proportions are p1 = 0.25 and p2 = 0.20 and the standard error of the sampling distribution of is 0.04. The calculated value of the test statistic will be:
is 0.04. The calculated value of the test statistic will be: Unlock Deck
Unlock for access to all 81 flashcards in this deck.
Unlock Deck
k this deck
5
We can design a matched pairs experiment when the data collected are:
Unlock Deck
Unlock for access to all 81 flashcards in this deck.
Unlock Deck
k this deck
6
A political analyst in Perth surveys a random sample of Labor Party members and compares the results with those obtained from a random sample of Liberal Party members. This would be an example of:
Unlock Deck
Unlock for access to all 81 flashcards in this deck.
Unlock Deck
k this deck
7
Which of the following best describes the symbol ?
? Unlock Deck
Unlock for access to all 81 flashcards in this deck.
Unlock Deck
k this deck
8
In testing the difference between two population means, using two independent samples, we use the pooled variance in estimating the standard error of the sampling distribution of the sample mean difference if the:
if the: Unlock Deck
Unlock for access to all 81 flashcards in this deck.
Unlock Deck
k this deck
9
A sample of size 150 from population 1 has 40 successes. A sample of size 250 from population 2 has 30 successes. The value of the test statistic for testing the null hypothesis that the proportion of successes in population 1 exceeds the proportion of successes in population 2 by 0.05 is:
Unlock Deck
Unlock for access to all 81 flashcards in this deck.
Unlock Deck
k this deck
10
In testing the difference between two population means, for which the population variances are unknown and are not assumed to be equal, two independent samples of large sizes are drawn from the populations. Which of the following tests is appropriate?
Unlock Deck
Unlock for access to all 81 flashcards in this deck.
Unlock Deck
k this deck
11
Which of the following is a required condition for using the normal approximation to the binomial distribution in testing the difference between two population proportions?
Unlock Deck
Unlock for access to all 81 flashcards in this deck.
Unlock Deck
k this deck
12
In testing the difference between the means of two normally distributed populations, the number of degrees of freedom associated with the unequal-variances t-test statistic usually results in a non-integer number. It is recommended that you:
Unlock Deck
Unlock for access to all 81 flashcards in this deck.
Unlock Deck
k this deck
13
For testing the difference between two population proportions, the pooled proportion estimate should be used to compute the value of the test statistic when the:
Unlock Deck
Unlock for access to all 81 flashcards in this deck.
Unlock Deck
k this deck
14
Two samples of sizes 35 and 50 are independently drawn from two normal populations, where the unknown population variances are assumed to be equal. The number of degrees of freedom of the equal-variances t-test statistic are:
Unlock Deck
Unlock for access to all 81 flashcards in this deck.
Unlock Deck
k this deck
15
In testing the difference between the means of two normal populations with known population standard deviations the test statistic calculated from two independent random samples equals 2.56. If the test is two-tailed and the 1% level of significance has been specified, the conclusion should be:
Unlock Deck
Unlock for access to all 81 flashcards in this deck.
Unlock Deck
k this deck
16
In testing whether the means of two normal populations are equal, summary statistics computed for two independent samples are as follows: n1 = 25, = 7.30, s1 = 1.05.
N2 = 30, = 6.80, s2 = 1.20.
Assume that the population variances are equal. Then the standard error of the sampling distribution of the sample mean difference is equal to:
= 7.30, s1 = 1.05.N2 = 30,
= 6.80, s2 = 1.20.Assume that the population variances are equal. Then the standard error of the sampling distribution of the sample mean difference
is equal to: Unlock Deck
Unlock for access to all 81 flashcards in this deck.
Unlock Deck
k this deck
17
If some natural relationship exists between each pair of observations that provides a logical reason to compare the first observation of sample 1 with the first observation of sample 2, the second observation of sample 1 with the second observation of sample 2, and so on, the samples are referred to as:
Unlock Deck
Unlock for access to all 81 flashcards in this deck.
Unlock Deck
k this deck
18
A sample of size 100 selected from one population has 53 successes, and a sample of size 150 selected from a second population has 95 successes. The test statistic for testing the equality of the population proportions is equal to:
Unlock Deck
Unlock for access to all 81 flashcards in this deck.
Unlock Deck
k this deck
19
In testing the difference between the means of two normal populations, using two independent samples, when the population variances are unknown and unequal, the sampling distribution of the resulting statistic is:
Unlock Deck
Unlock for access to all 81 flashcards in this deck.
Unlock Deck
k this deck
20
A test is being conducted to test the difference between two population means, using data that are gathered from a matched pairs experiment. If the paired differences are normal, then the distribution used for testing is the:
Unlock Deck
Unlock for access to all 81 flashcards in this deck.
Unlock Deck
k this deck
21
Testing for the equality of two population means is the same as testing for the difference between two population means.
Unlock Deck
Unlock for access to all 81 flashcards in this deck.
Unlock Deck
k this deck
22
When the necessary conditions are met, a two-tail test is being conducted to test the difference between two population proportions. If the value of the test statistic z is 2.05, then the p-value is:
Unlock Deck
Unlock for access to all 81 flashcards in this deck.
Unlock Deck
k this deck
23
Two independent samples of sizes 30 and 35 are randomly selected from two normal populations with equal variances. Which of the following is the test statistic that should be used to test the difference between the population means?
Unlock Deck
Unlock for access to all 81 flashcards in this deck.
Unlock Deck
k this deck
24
When testing for the difference between two population means and the population variances are unknown, a t test is used.
Unlock Deck
Unlock for access to all 81 flashcards in this deck.
Unlock Deck
k this deck
25
The degrees of freedom for a t test of the difference of population means in a matched pairs experiment is samples is n1 - 1, because n1 = n2.
Unlock Deck
Unlock for access to all 81 flashcards in this deck.
Unlock Deck
k this deck
26
A course coordinator at a university wants to investigate if there is a significant difference in the
average final mark of students taking the same university subject in semester 1 or semester 2.
A random sample of 30 students is taken from semester 1, with the average final mark is found to be
60% and the standard deviation is 5%.
A random sample of 50 students is taken from semester 2, with the average final mark is 57% and the
standard deviation is 4%.
Assuming that the population variances are equal, is there significant evidence that the population
average final mark in this course differs between semester 1 and semester 2. Test at the 5% level of
significance.
Unlock Deck
Unlock for access to all 81 flashcards in this deck.
Unlock Deck
k this deck
27
Two independent samples of sizes 40 and 50 are randomly selected from two normally distributed populations. Assume that the population variances are known. In order to test the difference between the population means, µ 1 - µ 2, which of the following test statistics should be used? A. t-test
B. Chi-square test
C. Z-test
D. None of these choices are correct.
B. Chi-square test
C. Z-test
D. None of these choices are correct.
Unlock Deck
Unlock for access to all 81 flashcards in this deck.
Unlock Deck
k this deck
28
The number of degrees of freedom associated with the t-test, when the data are gathered from a matched pairs experiment with 40 pairs, is:
Unlock Deck
Unlock for access to all 81 flashcards in this deck.
Unlock Deck
k this deck
29
A t test for testing the difference between two population means from two independent samples is the same as the t test to test the difference of two population means in a matched pairs experiment.
Unlock Deck
Unlock for access to all 81 flashcards in this deck.
Unlock Deck
k this deck
30
In a matched pairs experiment, when testing for the difference between two means, the value of µD is obtained by subtracting the first sample mean from the second sample mean.
Unlock Deck
Unlock for access to all 81 flashcards in this deck.
Unlock Deck
k this deck
31
The test statistic to test the difference between two population proportions is the Z test statistic, which requires that the sample sizes are each sufficiently large.
Unlock Deck
Unlock for access to all 81 flashcards in this deck.
Unlock Deck
k this deck
32
The Z test statistic is used to test for the difference in population means when the population variances are known.
Unlock Deck
Unlock for access to all 81 flashcards in this deck.
Unlock Deck
k this deck
33
For testing the difference between two population proportions, the pooled proportion estimate should be used to compute the value of the test statistic when the:
Unlock Deck
Unlock for access to all 81 flashcards in this deck.
Unlock Deck
k this deck
34
Two independent samples of sizes 30 and 40 are randomly selected from two populations to test the difference between the population means, µ 2 - µ 1, where the population variances are unknown. Which of the following best describes the sampling distribution of the sample mean difference ?
Unlock Deck
Unlock for access to all 81 flashcards in this deck.
Unlock Deck
k this deck
35
When testing the difference between two population proportions, a t test may be used.
Unlock Deck
Unlock for access to all 81 flashcards in this deck.
Unlock Deck
k this deck
36
The pooled proportion estimate is used to estimate the standard error of the difference between two proportions when the proportions of two populations are hypothesized to be equal.
Unlock Deck
Unlock for access to all 81 flashcards in this deck.
Unlock Deck
k this deck
37
A sample of size 100 selected from one population has 60 successes, and a sample of size 150 selected from a second population has 95 successes. The test statistic for testing the equality of the population proportions is equal to:
Unlock Deck
Unlock for access to all 81 flashcards in this deck.
Unlock Deck
k this deck
38
The degrees of freedom for a t test of the difference of population means from two independent samples are n1 + n2 - 2.
Unlock Deck
Unlock for access to all 81 flashcards in this deck.
Unlock Deck
k this deck
39
In random samples of 25 and 22 from each of two normal populations, we find the following statistics:
x1-bar = 56, s1 = 8.
x2-bar = 62, s2 = 8.5.
Assume that the population variances are equal.
Estimate with 95% confidence the difference between the two population means.
x1-bar = 56, s1 = 8.
x2-bar = 62, s2 = 8.5.
Assume that the population variances are equal.
Estimate with 95% confidence the difference between the two population means.
Unlock Deck
Unlock for access to all 81 flashcards in this deck.
Unlock Deck
k this deck
40
A university lecturer claims that students who attend lecturers score a higher final mark in her course than students who watch the lecture recordings online. The lecturer takes a random sample of the final marks of 40 students who attended her university lectures and found their average mark was 65% with a standard deviation of 5%. The lecturer takes a random sample of 30 university students who watched the lecture recordings online and found their average mark was 60% with a standard deviation of 8%. Is there significant evidence to support this university lecturer's claim? Test at the 5% level of significance, assuming that the population variances are unequal.
Unlock Deck
Unlock for access to all 81 flashcards in this deck.
Unlock Deck
k this deck
41
The following data were generated from a matched pairs experiment: a. Estimate with 90% confidence the mean difference.
b. Briefly describe what the interval estimate in part a. tells you, and explain how to use it to test the hypotheses.
b. Briefly describe what the interval estimate in part a. tells you, and explain how to use it to test the hypotheses.
Unlock Deck
Unlock for access to all 81 flashcards in this deck.
Unlock Deck
k this deck
42
In testing the hypotheses:
H0: p1 - p2 = 0.10
H1: p1 - p2 ≠ 0.10,
we found the following statistics:
n1 = 350, x1 = 178.
n2 = 250, x2 = 112.
What conclusion can we draw at the 5% significance level?
H0: p1 - p2 = 0.10
H1: p1 - p2 ≠ 0.10,
we found the following statistics:
n1 = 350, x1 = 178.
n2 = 250, x2 = 112.
What conclusion can we draw at the 5% significance level?
Unlock Deck
Unlock for access to all 81 flashcards in this deck.
Unlock Deck
k this deck
43
In testing the hypotheses:
H0: 1 - 2 = 0
HA: 1 - 2 0,
two random samples from two normal populations produced the following statistics:
n1 = 51, x1-bar = 35, s1 = 28.
n2 = 40, x2-bar = 28, s2 = 10.
Assume that the two population variances are different.
a. Estimate with 95% confidence the difference between the two population means.
b. Explain how to use this confidence interval for testing the hypotheses.
Unlock Deck
Unlock for access to all 81 flashcards in this deck.
Unlock Deck
k this deck
44
In testing the hypotheses:
H0: 1 - 2 = 0
HA: 1 - 2 > 0,
two random samples from two normal populations produced the following statistics:
n1 = 51, x1-bar = 35, s1 = 28.
n2 = 40, x2-bar = 28, s2 = 10.
Assume that the two population variances are different.
What conclusion can we draw at the 10% significance level?
H0: 1 - 2 = 0
HA: 1 - 2 > 0,
two random samples from two normal populations produced the following statistics:
n1 = 51, x1-bar = 35, s1 = 28.
n2 = 40, x2-bar = 28, s2 = 10.
Assume that the two population variances are different.
What conclusion can we draw at the 10% significance level?
Unlock Deck
Unlock for access to all 81 flashcards in this deck.
Unlock Deck
k this deck
45
The owner of a service station wants to determine whether the owners of new cars (two years old or less) change their cars' oil more frequently than owners of older cars (more than two years old). From his records, he takes a random sample of 10 new cars and 10 older cars and determines the number of times the oil was changed for each in the last 12 months. The data are shown below. Do these data allow the service station owner to infer at the 10% significance level that new car owners change their cars' oil more frequently than older car owners?
Unlock Deck
Unlock for access to all 81 flashcards in this deck.
Unlock Deck
k this deck
46
In testing the hypotheses:
H0: p1 - p2 = 0.10
H1 : p1 - p2 0.10
we find the following statistics:
n1 = 150, x1 = 72.
n2 = 175, x2 = 70.
a. What is the p-value of the test?
b. Briefly explain how to use the p-value to test the hypotheses, at a 1% level of significance.
H0: p1 - p2 = 0.10
H1 : p1 - p2 0.10
we find the following statistics:
n1 = 150, x1 = 72.
n2 = 175, x2 = 70.
a. What is the p-value of the test?
b. Briefly explain how to use the p-value to test the hypotheses, at a 1% level of significance.
Unlock Deck
Unlock for access to all 81 flashcards in this deck.
Unlock Deck
k this deck
47
In testing the hypotheses
H0: p1 - p2 = 0
HA: p1 - p2 < 0,
we find the following statistics:
n1 = 400, x1 = 105.
n2 = 500, x2 = 140.
Estimate with 90% confidence the difference between the two population proportions.
H0: p1 - p2 = 0
HA: p1 - p2 < 0,
we find the following statistics:
n1 = 400, x1 = 105.
n2 = 500, x2 = 140.
Estimate with 90% confidence the difference between the two population proportions.
Unlock Deck
Unlock for access to all 81 flashcards in this deck.
Unlock Deck
k this deck
48
A survey of 1500 Queenslanders reveals that 945 believe there is too much violence on television. In a survey of 1500 Western Australians, 810 believe that there is too much television violence.
Can we infer at the 99% significance level that the proportions of Queenslanders and Western Australians who believe that there is too much violence on television differ?
Can we infer at the 99% significance level that the proportions of Queenslanders and Western Australians who believe that there is too much violence on television differ?
Unlock Deck
Unlock for access to all 81 flashcards in this deck.
Unlock Deck
k this deck
49
In testing the hypotheses:
H0: p1 - p2 = 0
H1: p1 - p2 > 0,
we find the following statistics:
n1 = 200, x1 = 80.
n2 = 200, x2 = 140.
a. What is the p-value of the test?
b. What is the conclusion if tested at a 5% significance level?
c. Estimate with 95% confidence the difference between the two population proportions.
H0: p1 - p2 = 0
H1: p1 - p2 > 0,
we find the following statistics:
n1 = 200, x1 = 80.
n2 = 200, x2 = 140.
a. What is the p-value of the test?
b. What is the conclusion if tested at a 5% significance level?
c. Estimate with 95% confidence the difference between the two population proportions.
Unlock Deck
Unlock for access to all 81 flashcards in this deck.
Unlock Deck
k this deck
50
A simple random sample of ten firms was asked how much money (in thousands of dollars) they spent on employee training programs this year and how much they plan to spend on these programs next year. The data are shown below. Assume that the populations of amount spent on employee training programs are normally distributed.
a. Estimate with 95% confidence the mean difference.
b. Briefly explain what the interval estimate in part a. tells you.
Assume that the populations of amount spent on employee training programs are normally distributed.a. Estimate with 95% confidence the mean difference.
b. Briefly explain what the interval estimate in part a. tells you.
Unlock Deck
Unlock for access to all 81 flashcards in this deck.
Unlock Deck
k this deck
51
In testing the hypotheses:
H0: D = 5
HA: D 5,
two random samples from two normal populations produced the following statistics:
nD = 36, xD = 7.8, sD = 7.5.
What conclusion can we draw at the 5% significance level?
H0: D = 5
HA: D 5,
two random samples from two normal populations produced the following statistics:
nD = 36, xD = 7.8, sD = 7.5.
What conclusion can we draw at the 5% significance level?
Unlock Deck
Unlock for access to all 81 flashcards in this deck.
Unlock Deck
k this deck
52
In testing the hypotheses:
H0: p1 - p2 = 0.10
H1 : p1 - p2 0.10,
we find the following statistics:
n1 = 150, x1 = 72.
n2 = 175, x2 = 70.
What conclusion can we draw at the 5% significance level?
H0: p1 - p2 = 0.10
H1 : p1 - p2 0.10,
we find the following statistics:
n1 = 150, x1 = 72.
n2 = 175, x2 = 70.
What conclusion can we draw at the 5% significance level?
Unlock Deck
Unlock for access to all 81 flashcards in this deck.
Unlock Deck
k this deck
53
In order to test the hypotheses:
H0: µ 1 - µ 2 = 0
H1: µ 1 - µ 2 0,
we independently draw a random sample of 18 observations from a normal population with standard deviation of 15, and another random sample of 12 from a second normal population with standard deviation of 25.
a. If we set the level of significance at 5%, determine the power of the test when 1 - 2 = 5.
b. Describe the effect of reducing the level of significance on the power of the test.
Unlock Deck
Unlock for access to all 81 flashcards in this deck.
Unlock Deck
k this deck
54
A simple random sample of ten firms was asked how much money (in thousands of dollars) they spent on employee training programs this year and how much they plan to spend on these programs next year. The data are shown below. Assume that the populations of amount spent on employee training programs are normally distributed.
Can we infer at the 5% significance level that more money will be spent on employee training programs next year than this year?
Can we infer at the 5% significance level that more money will be spent on employee training programs next year than this year?
Unlock Deck
Unlock for access to all 81 flashcards in this deck.
Unlock Deck
k this deck
55
In testing the hypotheses:
H0: p1 - p2 = 0
H1: p1 - p2 ≠ 0,
we find the following statistics:
n1 = 200, x1 = 80.
n2 = 200, x2 = 140.
What conclusion can we draw at the 10% significance level?
H0: p1 - p2 = 0
H1: p1 - p2 ≠ 0,
we find the following statistics:
n1 = 200, x1 = 80.
n2 = 200, x2 = 140.
What conclusion can we draw at the 10% significance level?
Unlock Deck
Unlock for access to all 81 flashcards in this deck.
Unlock Deck
k this deck
56
Test the following hypotheses at the 5% level of significance:
H0: µ 1 - µ 2 = 0
HA: µ 1 - µ 2 < 0,
given the following statistics:
n1 = 10, x1 = 58.6, s1 = 13.45.
n2 = 10, x2 = 64.6, s2 = 11.15.
Estimate with 95% confidence the difference between the two population means.
H0: µ 1 - µ 2 = 0
HA: µ 1 - µ 2 < 0,
given the following statistics:
n1 = 10, x1 = 58.6, s1 = 13.45.
n2 = 10, x2 = 64.6, s2 = 11.15.
Estimate with 95% confidence the difference between the two population means.
Unlock Deck
Unlock for access to all 81 flashcards in this deck.
Unlock Deck
k this deck
57
The following data were generated from a matched pairs experiment: Determine whether these data are sufficient to infer at the 10% significance level that the two population means differ.
Unlock Deck
Unlock for access to all 81 flashcards in this deck.
Unlock Deck
k this deck
58
In testing the hypotheses:
H0: p1 - p2 = 0.10
H1 : p1 - p2 0.10,
we find the following statistics:
n1 = 150, x1 = 72.
n2 = 175, x2 = 70.
a. Estimate with 95% confidence the difference between the two population proportions.
b. Explain how to use the confidence interval in part a. to test the hypotheses.
H0: p1 - p2 = 0.10
H1 : p1 - p2 0.10,
we find the following statistics:
n1 = 150, x1 = 72.
n2 = 175, x2 = 70.
a. Estimate with 95% confidence the difference between the two population proportions.
b. Explain how to use the confidence interval in part a. to test the hypotheses.
Unlock Deck
Unlock for access to all 81 flashcards in this deck.
Unlock Deck
k this deck
59
In testing the hypotheses:
H0: p1 - p2 = 0.10
HA: p1 - p2 > 0.10,
we found the following statistics:
n1 = 350, x1 = 178.
n2 = 250, x2 = 112.
a. What is the p-value of the test?
b. Use the p-value to test the hypotheses at the 10% level of significance.
c. Estimate with 90% confidence the difference between the two population proportions.
Unlock Deck
Unlock for access to all 81 flashcards in this deck.
Unlock Deck
k this deck
60
In testing the hypotheses
H0: p1 - p2 = 0
HA: p1 - p2 ≠ 0,
we find the following statistics:
n1 = 400, x1 = 105.
n2 = 500, x2 = 140.
What conclusion can we draw at the 10% significance level?
H0: p1 - p2 = 0
HA: p1 - p2 ≠ 0,
we find the following statistics:
n1 = 400, x1 = 105.
n2 = 500, x2 = 140.
What conclusion can we draw at the 10% significance level?
Unlock Deck
Unlock for access to all 81 flashcards in this deck.
Unlock Deck
k this deck
61
A politician regularly polls her electorate to ascertain her level of support among voters. This month, 652 out of 1158 voters support her. Five months ago, 412 out of 982 voters supported her. At the 1% significance level, can she claim that support has increased by at least 10 percentage points?
Unlock Deck
Unlock for access to all 81 flashcards in this deck.
Unlock Deck
k this deck
62
A politician has commissioned a survey of blue-collar and white-collar employees in her electorate. The survey reveals that 286 out of 542 blue-collar workers intend to vote for her in the next election, whereas 428 out of 955 white-collar workers intend to vote for her.
a. Can she infer at the 5% level of significance that the level of support differs between the two groups of workers?
b. What is the p-value of the test? Explain how to use it to test the hypotheses.
a. Can she infer at the 5% level of significance that the level of support differs between the two groups of workers?
b. What is the p-value of the test? Explain how to use it to test the hypotheses.
Unlock Deck
Unlock for access to all 81 flashcards in this deck.
Unlock Deck
k this deck
63
Ten functionally illiterate adults were given an experimental one-week crash course in reading. Each of the 10 was given a reading test prior to the course and another test after the course. The results are shown below. a. Estimate the mean improvement with 95% confidence.
b. Briefly describe what the interval estimate in part a. tells you.
a. Estimate the mean improvement with 95% confidence.b. Briefly describe what the interval estimate in part a. tells you.
Unlock Deck
Unlock for access to all 81 flashcards in this deck.
Unlock Deck
k this deck
64
A quality control inspector keeps a tally sheet of the numbers of acceptable and unacceptable products that come off two different production lines. The completed sheet is shown below. a. What is the p-value of the test?
b. Estimate with 95% confidence the difference in population proportions.
a. What is the p-value of the test?b. Estimate with 95% confidence the difference in population proportions.
Unlock Deck
Unlock for access to all 81 flashcards in this deck.
Unlock Deck
k this deck
65
A management consultant wants to compare the incomes of graduates of MBA programs with those of graduates with Bachelor's degrees. In a random sample of the incomes of 20 people taken five years after they received their MBAs, the consultant found the mean salary and the standard deviation to be $45 300 and $9600, respectively. A random sample of the incomes of 25 people taken five years after they received their Bachelor's degrees yielded a mean salary of $43 600 with a standard deviation of $12 300.
Can we infer at the 10% level of significance that the population means differ?
Can we infer at the 10% level of significance that the population means differ?
Unlock Deck
Unlock for access to all 81 flashcards in this deck.
Unlock Deck
k this deck
66
An industrial statistician wants to determine whether efforts to promote safety have been successful. By checking the records of 250 employees, he finds that 30 of them have suffered either minor or major injuries that year. A random sample of 400 employees taken in the previous year revealed that 80 had suffered some form of injury.
a. Can the statistician infer at the 5% significance level that efforts to promote safety have been successful?
b. What is the p-value of the test?
a. Can the statistician infer at the 5% significance level that efforts to promote safety have been successful?
b. What is the p-value of the test?
Unlock Deck
Unlock for access to all 81 flashcards in this deck.
Unlock Deck
k this deck
67
A political poll taken immediately prior to a state election reveals that 158 out of 250 male voters and 105 out of 200 female voters intend to vote for the Independent candidate.
Can we infer at the 5% significance level that the proportions of male and female voters who intend to vote for the Independent candidate differ?
Can we infer at the 5% significance level that the proportions of male and female voters who intend to vote for the Independent candidate differ?
Unlock Deck
Unlock for access to all 81 flashcards in this deck.
Unlock Deck
k this deck
68
Thirty-five employees who completed two years of tertiary education were asked to take a basic mathematics test. The mean and standard deviation of their marks were 75.1 and 12.8, respectively. In a random sample of 50 employees who only completed high school, the mean and standard deviation of the test marks were 72.1 and 14.6, respectively.
a. Estimate with 90% confidence the difference in mean scores between the two groups of employees.
b. Explain how to use the interval estimate in part a. to test the hypotheses.
a. Estimate with 90% confidence the difference in mean scores between the two groups of employees.
b. Explain how to use the interval estimate in part a. to test the hypotheses.
Unlock Deck
Unlock for access to all 81 flashcards in this deck.
Unlock Deck
k this deck
69
Motor vehicle insurance appraisers examine cars that have been involved in accidental collisions to assess the cost of repairs. An insurance executive is concerned that different appraisers produce significantly different assessments. In an experiment, 10 cars that had recently been involved in accidents were shown to two appraisers. Each assessed the estimated repair costs. The results are shown below. Can the executive conclude at the 5% significance level that the appraisers differ in their assessments?
Unlock Deck
Unlock for access to all 81 flashcards in this deck.
Unlock Deck
k this deck
70
A quality control inspector keeps a tally sheet of the numbers of acceptable and unacceptable products that come off two different production lines. The completed sheet is shown below. Can the inspector infer at the 5% significance level that production line 1 is doing a better job than production line 2?
Can the inspector infer at the 5% significance level that production line 1 is doing a better job than production line 2? Unlock Deck
Unlock for access to all 81 flashcards in this deck.
Unlock Deck
k this deck
71
Ten functionally illiterate adults were given an experimental one-week crash course in reading. Each of the 10 was given a reading test prior to the course and another test after the course. The results are shown below. Is there enough evidence to infer at the 5% significance level that the reading scores have improved?
Unlock Deck
Unlock for access to all 81 flashcards in this deck.
Unlock Deck
k this deck
72
The managing director of a breakfast cereal manufacturer claims that families in which both spouses work are much more likely to be consumers of his product than those with only one working spouse. To prove his point, he commissions a survey of 300 families in which both spouses work and 300 families with only one working spouse. Each family is asked whether the company's cereal is eaten for breakfast. The results are shown below. Use the p-value method to test the managing director's claim, at a 5% significance level of
significance.
Use the p-value method to test the managing director's claim, at a 5% significance level ofsignificance.
Unlock Deck
Unlock for access to all 81 flashcards in this deck.
Unlock Deck
k this deck
73
Do government employees take longer tea breaks than private-sector workers? That is the question that interested a management consultant. To examine the issue, he took a random sample of nine government employees and another random sample of nine private-sector workers and measured the amount of time (in minutes) they spent in tea breaks during the day. The results are listed below. Do these data provide sufficient evidence at the 5% significance level to answer the consultant's question in the affirmative?
Unlock Deck
Unlock for access to all 81 flashcards in this deck.
Unlock Deck
k this deck
74
Thirty-five employees who completed two years of tertiary education were asked to take a basic mathematics test. The mean and standard deviation of their marks were 75.1 and 12.8, respectively. In a random sample of 50 employees who only completed high school, the mean and standard deviation of the test marks were 72.1 and 14.6, respectively.
Can we infer at the 10% significance level that a difference exists between the two groups?
Can we infer at the 10% significance level that a difference exists between the two groups?
Unlock Deck
Unlock for access to all 81 flashcards in this deck.
Unlock Deck
k this deck
75
A psychologist has performed the following experiment. For each of 10 sets of identical twins who were born 30 years ago, she recorded their annual incomes according to which twin was born first. The results (in $000) are shown below. Can she infer at the 5% significance level that there is a difference in income between the twins?
Unlock Deck
Unlock for access to all 81 flashcards in this deck.
Unlock Deck
k this deck
76
A political poll taken immediately prior to a state election reveals that 158 out of 250 male voters and 105 out of 200 female voters intend to vote for the Independent candidate.
a. What is the p-value of the test?
b. Estimate with 95% confidence the difference between the proportions of male and female voters who intend to vote for the Independent candidate.
c. Explain how to use the interval estimate in part b. to test the hypotheses.
a. What is the p-value of the test?
b. Estimate with 95% confidence the difference between the proportions of male and female voters who intend to vote for the Independent candidate.
c. Explain how to use the interval estimate in part b. to test the hypotheses.
Unlock Deck
Unlock for access to all 81 flashcards in this deck.
Unlock Deck
k this deck
77
A marketing consultant is studying the perceptions of married couples concerning their weekly food expenditures. He believes that the husband's perception would be higher than the wife's. To judge his belief, he takes a random sample of 10 married couples and asks each spouse to estimate the family food expenditure (in dollars) during the previous week. The data are shown below. Can the consultant conclude at the 5% significance level that the husband's estimate is higher than the wife's estimate?
Unlock Deck
Unlock for access to all 81 flashcards in this deck.
Unlock Deck
k this deck
78
The managing director of a breakfast cereal manufacturer believes that families in which both spouses work are much more likely to be consumers of his product than those with only one working spouse. To prove his point, he commissions a survey of 300 families in which both spouses work and 300 families with only one working spouse. Each family is asked whether the company's cereal is eaten for breakfast. The results are shown below. Do these data provide enough evidence at the 1% significance level to infer that the proportion of families with two working spouses who eat the cereal is at least 5% larger than the proportion of families with one working spouse who eats the cereal?
Do these data provide enough evidence at the 1% significance level to infer that the proportion of families with two working spouses who eat the cereal is at least 5% larger than the proportion of families with one working spouse who eats the cereal? Unlock Deck
Unlock for access to all 81 flashcards in this deck.
Unlock Deck
k this deck
79
Because of the rising costs of industrial accidents, many chemical, mining and manufacturing firms have instituted safety courses. Employees are encouraged to take these courses, which are designed to heighten safety awareness. A company is trying to decide which one of two courses to institute. To help make a decision, eight employees take course 1 and another eight take course 2. Each employee takes a test, which is graded out of a possible 25. The safety test results are shown below. Assume that the scores are normally distributed. Does the data provide sufficient evidence at the 5% level of significance to infer that the marks from course 1 are lower than those from course 2?
Unlock Deck
Unlock for access to all 81 flashcards in this deck.
Unlock Deck
k this deck
80
Do interstate drivers exceed the speed limit more frequently than local motorists? This vital question was addressed by the Road Traffic Authority. A random sample of the speeds of 2500 randomly selected cars was categorised according to whether the car was registered in the state or in some other state, and whether or not the car was violating the speed limit. The data are shown below. Do these data provide enough evidence to support the highway patrol's claim at the 5% significance level?
Do these data provide enough evidence to support the highway patrol's claim at the 5% significance level? Unlock Deck
Unlock for access to all 81 flashcards in this deck.
Unlock Deck
k this deck
Unlock Deck
Unlock for access to all 81 flashcards in this deck.


